By Watershed Protection Program Co-Op Vincent Liu
Large-scale plastic production has been around since the 1950s, and while plastics existed prior, it was not until this time where plastics began making their way into many aspects of life. With the rise of plastic as a popular material, microplastics emerged as a new contaminant. Microplastics are small pieces of plastic, less than 5mm in size, and they are everywhere. In even the most remote waters of Earth, microplastics can be found. Microplastics are not a recent environmental concern as they have been extensively studied in the marine environment. The presence and impact of microplastics on freshwater ecosystems, however, has been a topic of interest in recent years. With its ability to persist in the environment and being incredibly difficult to remove efficiently, microplastics have established themselves as a worrying pollutant.
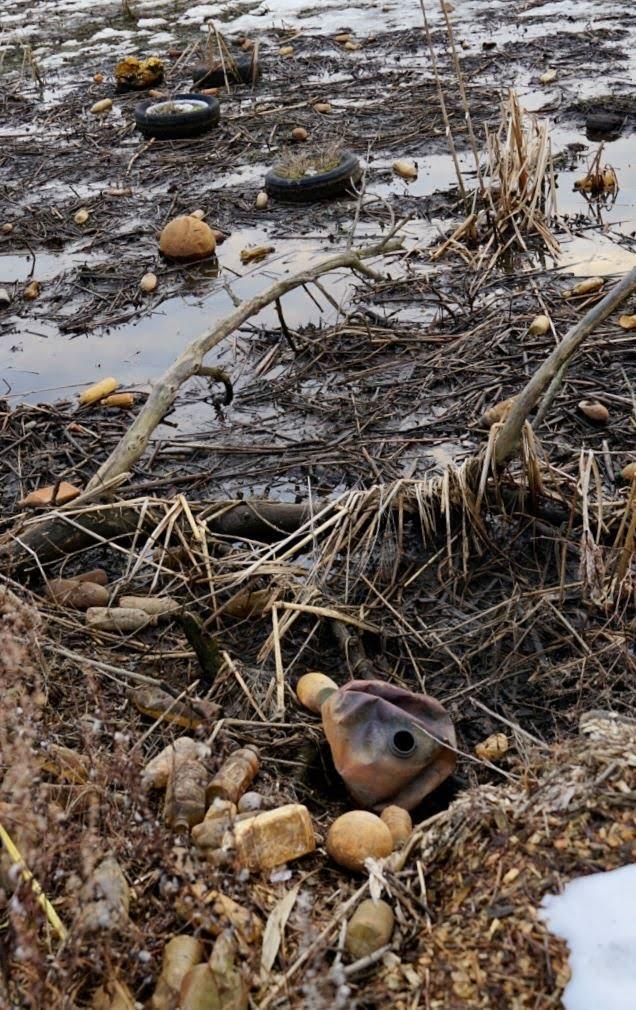
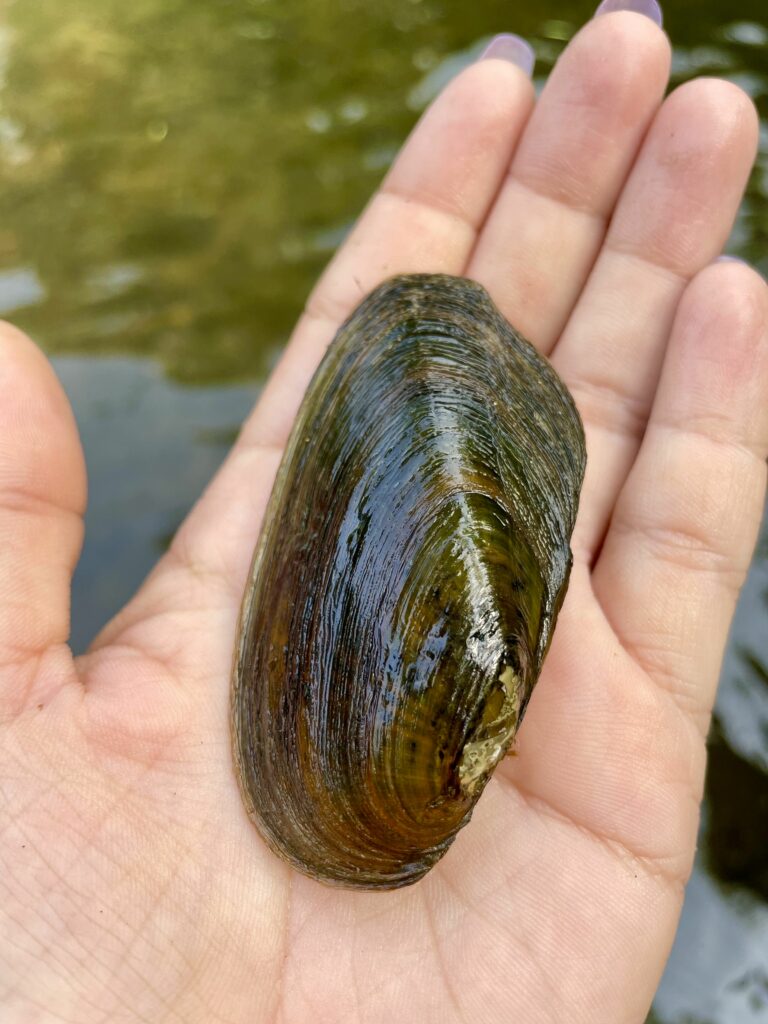
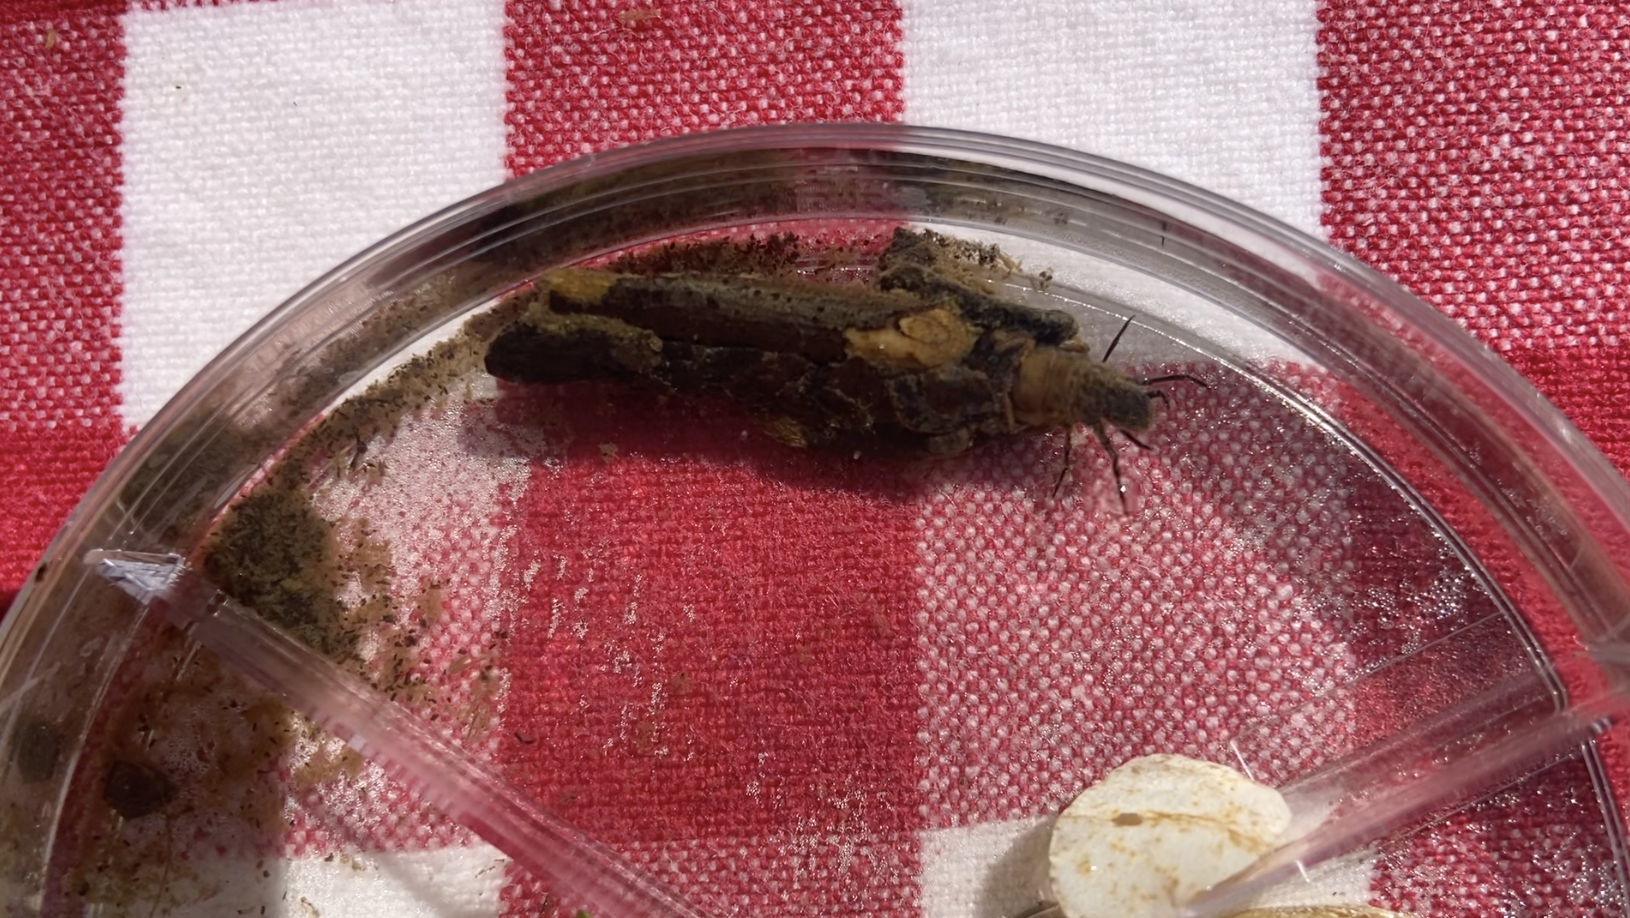
Microplastics are formed when larger pieces of plastic break apart into smaller ones. They can come from a wide variety of sources, such as textiles, industry, and packaging. Single-use plastics that reach the environment gradually break into microplastics that can then wash into a stream from a storm event. Plastic fibers are easily shed in the washing machine and then end up in wastewater that enters streams and rivers. These are just some of the many ways that microplastics are released into water. The biological effects of microplastics are yet to be clearly defined, but harmful impacts have been found in studies involving freshwater fish and bottom-dwelling macroinvertebrates. Macroinvertebrates are small animals that lack a backbone, and some species are often used by scientists as indicators of stream health. A study by Redondo-Hasselerharm et. al in 2018 showed that the impact of microplastics on macroinvertebrates is species dependent, with some species being highly sensitive to microplastics and others not being affected at all. Specific health effects were also found in fish including liver damage and reduced growth.
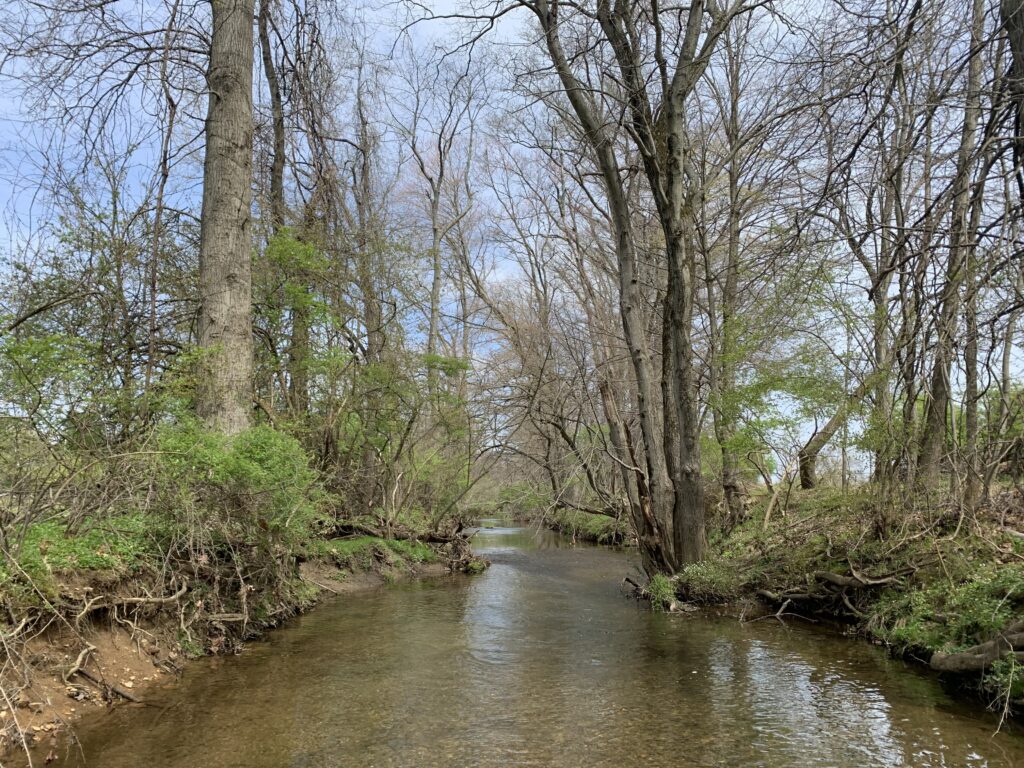
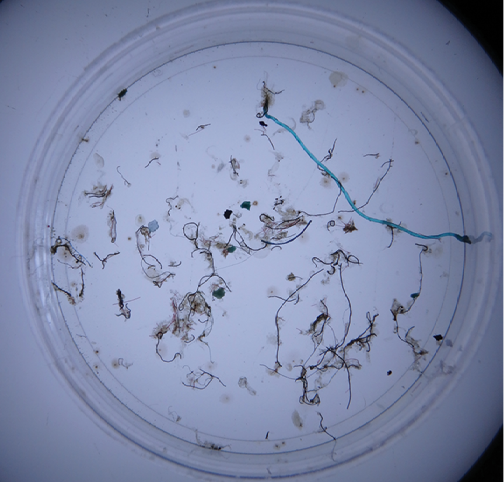
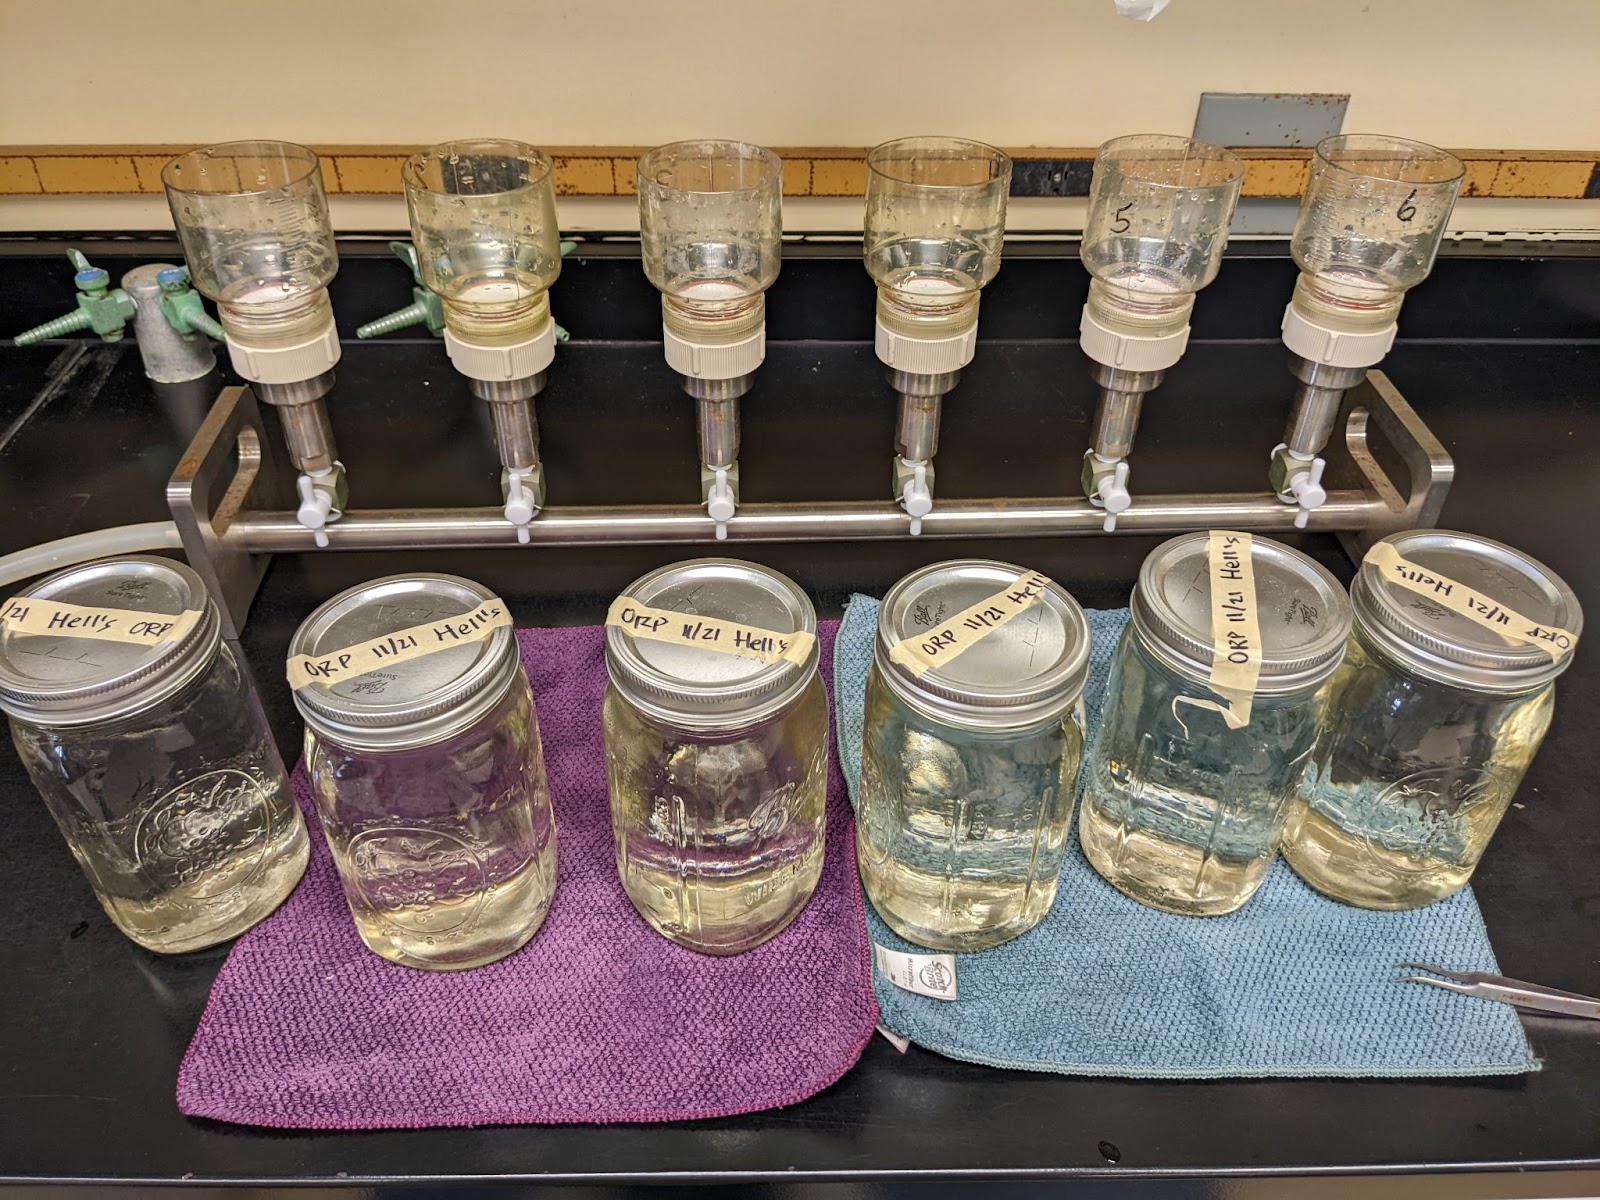
I did my senior project on observing microplastics in Pennsylvanian streams while working with the environmental policy organization, PennEnvironment, on their citizen science microplastic project. PennEnvironment staff collected samples while I assisted in processing samples and analyzing the data. The samples were collected in glass jars, to help reduce the plastic contamination, and were run through a filtration system that draws the water sample through a filter, leaving just the suspended solid material from the water. The filter is placed under a microscope to detect the presence of microplastics within the sample. The 4 categories of microplastics that this project looked for were fibers, fragments, films, and beads. Fibers are long, thin strands of plastic that usually come from textiles. Films are flat, wide, and typically transparent. Beads are round spheres, often found in personal care products prior to 2015. Fragments are plastics that do not fit any of the other categories. A microplastic was distinguished from a natural material by using the squish test, which is a simple test done by poking the suspected microplastic with tweezers. Plastic will not break. It will either maintain its shape or mold into a different shape.
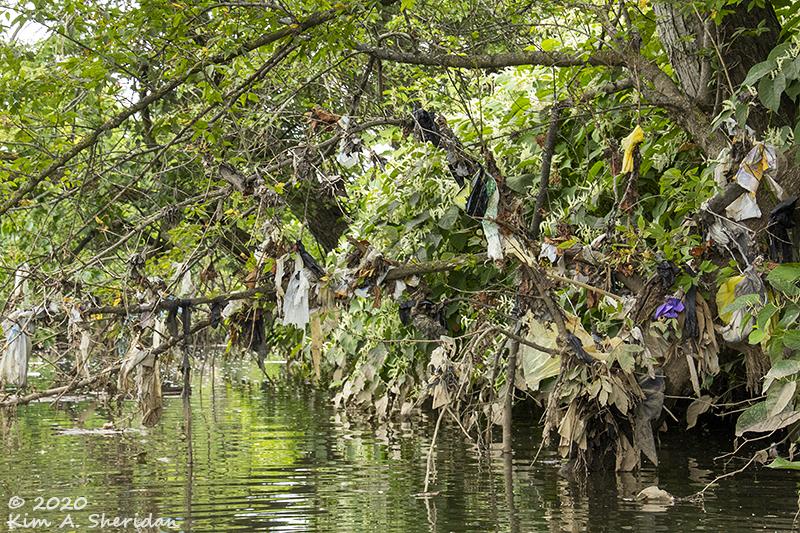
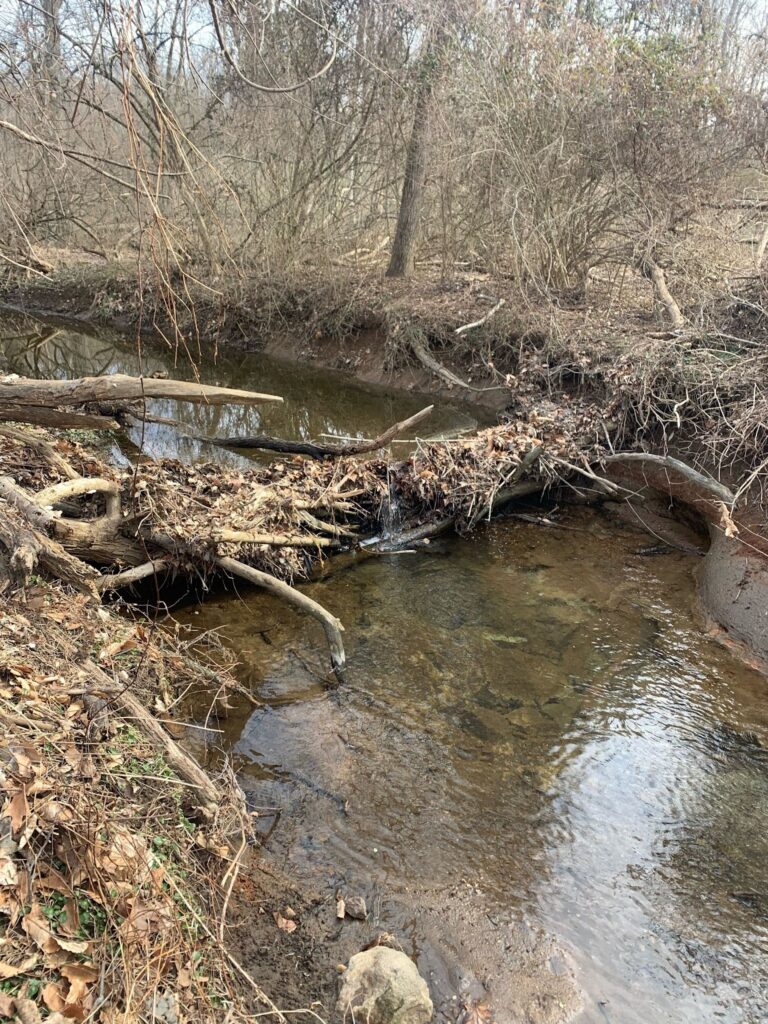
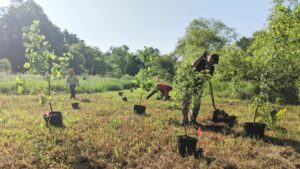
The results of the project confirmed the presence of microplastics in every stream that was sampled. What was particularly interesting was the low amount of microbeads compared to every other category of plastic. Beads were by far the least common category of microplastic. This can most likely be attributed to the Microbead-Free Waters Act in 2015, which banned plastic microbeads in rinse-off cosmetics. It was also notable that samples had wildly varying amounts of microplastic, though concentration was not calculated for this project. The site photos from where the samples were collected often told a story as well. In one of the sites, there was a blue tarp that was hanging from a tree into the stream just upstream of the collection site. During microplastic analysis for that sample, there was a noticeably high count of blue microfibers.
Finding ways to remediate microplastic already existing in the environment is an ongoing pursuit, but policy changes can reduce microplastic output from the source. The microbead ban leading to almost a complete disappearance of microbeads in waterways is an example of how legislation can lead to reductions of microplastic contamination. Policy changes in reducing unnecessary plastic usage and encouraging the use of alternative materials will reduce the amount of microplastics entering the streams. After over 70 years of mass plastic production, it may be time to switch gears and look for alternatives.
— By Watershed Protection Program Co-Op Vincent Liu
References
Parker, B., Andreou, D., Green, I. D., & Britton, J. R. (2021). Microplastics in freshwater fishes: Occurrence, impacts and future perspectives. Fish and Fisheries, 22(3), 467–488. https://doi.org/10.1111/faf.12528
Redondo-Hasselerharm, Paula E., et al. “Microplastic Effect Thresholds for Freshwater Benthic Macroinvertebrates.” Environmental Science & Technology, vol. 52, no. 4, 30 Jan. 2018, pp. 2278–2286, https://pubs.acs.org/doi/10.1021/acs.est.7b05367
Eerkes-Medrano, D., Thompson, R. C., & Aldridge, D. C. (2015). Microplastics in freshwater systems: A review of the emerging threats, identification of knowledge gaps and prioritisation of research needs. Water Research, 75, 63–82. https://doi.org/10.1016/j.watres.2015.02.012
Birch, Q. T., Potter, P. M., Pinto, P. X., Dionysiou, D. D., & Al-Abed, S. R. (2020). Sources, transport, measurement and impact of nano and microplastics in urban watersheds. Reviews in Environmental Science and Bio/Technology, 19(2), 275–336. https://doi.org/10.1007/s11157-020-09529-x
Geyer, R., Jambeck, J. R., & Law, K. L. (2017). Production, use, and fate of all plastics ever made. Science Advances, 3(7). https://doi.org/10.1126/sciadv.1700782
Center for Food Safety and Applied Nutrition. “The Microbead-Free Waters Act.” U.S. Food and Drug Administration, 2018, www.fda.gov/cosmetics/cosmetics-laws-regulations/microbead-free-waters-act-faqs.b