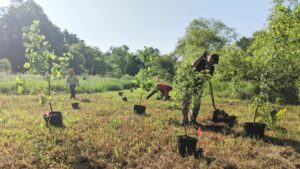
WILLISTOWN CONSERVATION TRUST

  • Facebook
  • Instagram
  • Twitter
  • YouTube
GIVE
  • About
    • OUR STORY
    • HOW WE WORK
    • WHERE WE WORK
    • DIVERSITY, EQUITY & INCLUSION STATEMENT
    • OUR STAFF AND TRUSTEES
    • OUR NATURE PRESERVES
    • JOBS & INTERNSHIPS
    • FAQs
  • LATEST
    • BLOG
    • PUBLICATIONS
    • IN THE NEWS
    • PHOTOS
  • PROGRAMS
    • BIRD CONSERVATION
    • COMMUNITY FARM
    • EDUCATION
    • LAND PROTECTION
    • STEWARDSHIP
      • TRAILS
    • WATERSHED PROTECTION
  • EVENTS
    • EVENT CALENDAR
    • BARNS & BBQ
    • RUN-A-MUCK
    • WILDFLOWER WEEK
    • PLASTIC FREE JULY
    • RUSHTON NATURE KEEPERS (RNK)
  • Support
    • SPONSOR THE TRUST
    • JOIN THE SYCAMORE SOCIETY
    • LEGACY SOCIETY & PLANNED GIVING
    • CAMPAIGN FOR RUSHTON WOODS PRESERVE
    • WAYS TO GIVE
    • VOLUNTEER
    • OUR SUPPORTERS
  • Rushton Conservation Center

The Tale of Two Streams

June 25, 2022 By Anna Willig

Every four weeks, the Watershed Protection Program heads over to East Goshen to visit two branches of Ridley Creek near the Goshenville Blacksmith Shop. We trudge down the road to our first site, RC1, which lies in the main stem of Ridley Creek. We hop in the creek, take measurements, collect samples, and then we walk about 150 feet to our next site, WBRC1, West Branch Ridley Creek, where we do it all over again. Even though these two sample sites are right next to each other, WBRC1 is in a completely different creek. Just downstream from these two sample sites, the West Branch merges into Ridley Creek, and the waters from the sample sites flow together as one.

Ridley Creek

In many ways, these two streams are identical. The amount of water flowing through them is nearly the same. Also similar in size is the size of land they drain. Their banks are lined by both trees and shrubs, with a few patches of clearing. The stream beds are rocky along with some sand and mud near the banks. Given all of these similarities, it would be easy to imagine that the water quality is similar at these two sites, as well.

image preview
West Branch Ridley Creek

However, as the Watershed Protection Team discovered, once we started looking at the water chemistry, we found that the two streams are quite different. Immediately, we noticed differences in specific conductivity. Specific conductivity measures the ease at which electricity can move through water, and pure water is a terrible conductor, meaning it has low specific conductivity. So when we find that specific conductivity is high in water, then that tells us that there are pollutants present. Comparing WBRC1 and RC1, we found that the specific conductivity is much higher in WBRC1 than RC1, meaning the water quality is much lower in WBRC1. However, specific conductivity cannot tell us which pollutants are in the water–it can only indicate that there are pollutants.  

Specific Conductivity Data for RC1 and WBRC1

Looking deeper into the chemistry, we found that WBRC1 contains higher concentrations of chlorides, nitrogen, and phosphorus, all of which increase specific conductivity. So where are they coming from? For chlorides, the answer is road salts. After road salts are applied in winter, they runoff into streams and groundwaters, where they can persist throughout the year, leading to higher concentrations of chlorides year round. For nitrogen and phosphorus, the answer is a little more complicated. They can come from a few different sources, most commonly fertilizers, leaky septic and sewer systems, and animal waste. Elevated concentrations of chlorides, nitrogen, and phosphorus are concerning because these pollutants can threaten the survival of sensitive stream organisms, such as mussels, trout, and stream insects. 

RC1 and WBRC1 Chloride Data

However, this poses more questions: why are there higher concentrations of salts and nutrients at WBRC1? How could water chemistry at two sites only 150 feet apart from each other be so different? To understand where these contaminants are coming from, we needed to look at what is going on in the land upstream of each sample site. And what we found is a difference in impervious surfaces.

Phosphorus Bar Graph
Nitrogen Bar Graph

Impervious surfaces are any surfaces that water cannot directly pass through, such as roads, sidewalks, parking lots, driveways, and buildings. These surfaces have several direct and indirect impacts on water quality. Many impervious surfaces are treated with road salt in the winter, and any rain or snow that hits these surfaces will carry that salt into the stream, increasing chloride concentrations. Impervious surfaces also reflect human activity in an area. Generally, the more impervious surfaces in an area, the more humans, and with more humans comes more fertilizer applications on lawns and gardens and more septic and sewer systems, all of which can flow into streams. As a result, there is a strong relationship between the amount of impervious surface cover and the pollutants that drain into a stream system.

We found that of the land that drains into WBRC1, 20% of that area is covered by impervious surfaces, as compared with RC1, where only 14% of the area is covered by impervious surfaces. While 6% may seem like a small difference, it is large enough to account for the difference in water quality of these two streams. This tells us that for Ridley Creek to maintain its health and water quality, we need to strive to stay below 20% impervious surfaces, and maybe even less than that. 

image preview
Catchments draining into West Branch Ridley Creek (WBRC1) and main stem Ridley Creek (RC1) sampling sites. Note the dense impervious surface cover in the WBRC1 catchment compared to the RC1 catchment.

The story of these two streams can be a hopeful one, and there are many lessons to be learned. If we can keep the amount of impervious surfaces down, we can protect water quality, even at an incredibly local scale. The more land we can protect as open space, the better the water quality in our streams and rivers. 

In addition to protecting land, we as individuals can also reduce the impact that impervious surfaces have on streams by doing the following:

  1. Limiting the amount of road salt used in the winter or sweeping up road salt after storms pass. This is a great way to reduce the amount of salt entering streams. 
  2. Reducing fertilizer use and avoiding applying fertilizers before rainstorms.
  3. Planting rain gardens alongside roads and driveways to help collect and filter stormwater, further reducing the amount of salts and nutrients entering streams. Native flowers, shrubs, and trees are great at absorbing excess nutrients and salts before they enter streams, and planting more of these plants will go a long way towards improving water quality.  
  4. Finding more tips here: Healthy Streams Start with Healthy Landscapes.

No matter how far away you are from a stream, any action you can take will make a difference.  

— By Watershed Conservation Associate Anna Willig

Sources:

Baker, M. E., Schley, M. L., & Sexton, J. O. (2019). Impacts of Expanding Impervious Surface on Specific Conductance in Urbanizing Streams. Water Resources Research, 55(8), 6482–6498. https://doi.org/10.1029/2019WR025014

Morse, C. C., Huryn, A. D., & Cronan, C. (2003). Impervious Surface Area as a Predictor of the Effects of Urbanization on Stream Insect Communities in Maine, U.S.A. Environmental Monitoring and Assessment, 89(1), 95–127. https://doi.org/10.1023/A:1025821622411

Filed Under: Nature, Science, Watershed

Beaver Business

January 4, 2022 By Anna Willig

Please Note: The Watershed Protection Team is excited to welcome our newest team member and encourages all visitors to keep an eye out for beavers at Ashbridge but please do not go searching for them. The health of our waterways will benefit from the presence of Castor canadensis, so please be respectful of their space.  

In the middle of the 2021 spring tree planting, the Watershed Protection Team had quite the surprise when we spotted evidence of beaver activity in Ashbridge Preserve. A single tree was knocked down along Ridley Creek, with distinctive teeth marks that indicated a beaver had found itself a tasty meal. In October, the first lodge was located, and it was clear that the beavers had settled in the center of 1,000 freshly planted trees. But more than concern was a feeling of validation; the hard work of every staff member, volunteer and student has resulted in the creation of suitable habitat for one of nature’s most effective ecosystem engineers.

  • A beaver caught on the Trust’s wildlife cam
  • Evidence of beaver activity at Ashbridge Preserve. Photo by author.

Beavers (Castor canadensis) are the largest rodent found in North America, reaching 3 feet in length and weighing between 30 and 60 pounds. They have small faces, stocky brown bodies, and a distinctively hairless, paddle-shaped tail. Their tail allows beavers to be distinguished from groundhogs, which have short, furry tails, and muskrats, which have long, hairless tails. Beavers are well-adapted for an aquatic lifestyle: when they dive underwater, their eyes are protected by a set of transparent eyelids and their ears and nose are protected by watertight membranes. They even have a second set of lips that close behind their teeth, which allows them to chew while underwater and not drown. They can remain underwater for 15 minutes, and their oily, waterproof fur helps them stay dry. Their webbed feet and rudder-like tail allows beavers to swim at speeds of 5 miles per hour.

Chompy the beaver was donated to Willistown Conservation Trust and currently lodges in the Rushton Conservation Center. Note its glossy fur and hairless, paddle-shaped tail. Photo by author.

Beavers were once abundant throughout North America, from northern Mexico all the way up to the southern Arctic. However, they were heavily hunted for their waterproof pelts by European colonizers, and their numbers dropped rapidly. In Pennsylvania, beavers were wiped out by the beginning of the 20th century. Reintroduction efforts in the 1920s proved successful, and beaver populations have been stable in Pennsylvania since the 1930s, though they likely are not as abundant as they were before European colonization. There are a few known beaver colonies near Willistown in Ridley and Darby creeks, and evidence of beaver activity is occasionally spotted in Willistown, most recently at Ashbridge Preserve.

Beavers are perhaps nature’s most effective engineers, changing entire ecosystems to fit their needs. They build their homes, called lodges, almost exclusively in the middle of slow-moving ponds, where the surrounding water acts as a moat that protects them from terrestrial predators. If no such pond can be found, beavers dam streams and rivers to create the perfect pond. To create their dams, beavers cut down trees with their chisel-like teeth, which constantly grow and self-sharpen. They generally prefer trees with diameters of less than 3 inches, but will cut down larger trees if small trees are not readily available. They construct their dam with logs, branches, twigs, and grasses and seal everything into place with mud. 

Once the dam backs up enough water, beavers build wood and mud lodges in the middle of the pond that can be 6 feet high and up to 40 feet wide. These lodges have 1 or 2 underwater entrances, a ‘living area’ above the water line, and a small air hole in the top to provide ventilation. A lodge houses a colony made of a breeding pair — believed to mate for life — the current years’ kits, and the surviving offspring from the year before. Before the kits are born, the female drives out the second year young. After the young are driven out from the den, they disperse to find new habitat and form their own colonies. 

Beaver settlement causes widespread changes to an ecosystem. The first noticeable change is the clearing of several trees, usually small, that the beaver will use to build its dam. After the dam is built, the creek will start to back up, flooding the adjacent land and forming a small pond. More trees may be felled to build the beaver’s lodge. What was once a wooded valley with a small stream becomes an open pond bordered by wetland vegetation. This new pond supports a host of wetland species that would not otherwise be found in the area — ducks, geese, herons, turtles, fish, frogs, salamanders, and more. Even beaver lodges create habitat: the underwater base of the lodge provides shelter for young fish and the top of the lodge can be a nesting area for birds. 

A beaver captured on the Trust’s game cam

Beyond supporting a biodiverse ecosystem, beavers and their dams improve local water quality. Beaver ponds trap and slow down water, reducing downstream flooding during major storm events. By slowing down the flow of water, beaver dams also allow more water to seep through the soil and replenish groundwater resources. As water passes through a beaver pond, fine sediment and pollutants are filtered out, resulting in cleaner water downstream of the dam. 

Beavers inhabitat a pond until they deplete all nearby food sources, usually after 20 to 30 years. At this point, they abandon their pond and lodge and move on to new habitat. Without constant maintenance, the dam slowly breaks down and eventually breaches. The pond drains, and the previously-submerged seed bank begins to germinate. Shrubs and trees re-establish in the area and, eventually, the open land turns back into a wooded valley. 

If you want to learn more about the history, biology and benefits of having beaver living in local streams, join us for our upcoming virtual Beaver Talk on February 2!

References

Beaver. (n.d.). Pennsylvania Game Commission. Retrieved May 27, 2021, from https://www.pgc.pa.gov:443/Education/WildlifeNotesIndex/Pages/Beaver.aspx

Beaver. (2016, April 25). Smithsonian’s National Zoo. https://nationalzoo.si.edu/animals/beaver

Beaver | National Geographic. (n.d.). Retrieved May 27, 2021, from https://www.nationalgeographic.com/animals/mammals/facts/beaver

Wohl, E. (2021). Legacy effects of loss of beavers in the continental United States. Environmental Research Letters, 16(2), 025010. https://doi.org/10.1088/1748-9326/abd34e

Filed Under: Nature Preserves, Science, Watershed

A Macroinvertebrate’s Thanksgiving Feast

November 16, 2021 By Anna Willig

Each fall, trees provide a veritable Thanksgiving Feast for aquatic macroinvertebrates. They spend the whole spring and summer preparing this feast, growing it, maintaining it, making sure everything is just right, and, come fall, dropping it all in the stream. What is this feast? Leaves!

Leaves from trees and shrubs are a form of allochthonous input, or something that enters an ecosystem from outside of the system. In small headwater streams, such as those found in our area, allochthonous input is a dominant source of energy, essentially forming the base of the food chain. Generally, these small headwater streams are forested, preventing light from reaching streams, inhibiting photosynthesis, and thus limiting the growth of aquatic plants. Consequently, the main source of energy in these streams comes from trees in the form of fallen leaves.

Once leaves fall into the stream, microbes, such as bacteria and fungi, colonize leaves, starting the process of decomposition. Some macroinvertebrates, called shredders, eat the leaves themselves, feasting on the plant material. Other macroinvertebrates, called scrapers, eat the layer of algae, bacteria, and fungi that develops on fallen leaves. Both shredders and scrapers are eaten by predatory macroinvertebrates, which are in turn eaten by frogs, salamanders, fish, and other aquatic animals, moving energy up the food chain.  

Leaf litter in streams also provides important habitat for macroinvertebrates. Smaller macroinvertebrates can hide from predators in the leaf litter, while predatory macroinvertebrates can hide from unsuspecting prey in the leaf litter as well. 

Since leaf litter is so important for macroinvertebrate communities, any changes to the amount and type of leaf litter that reaches the stream can impact the macroinvertebrate community. In areas where trees have been cleared along stream banks, the primary energy input is no longer leaf litter. Rather, since sunlight can reach the stream, aquatic algae and vegetation will grow more readily and become the dominant source of energy. As a result, the macroinvertebrate community will shift to a community that primarily eats aquatic vegetation and algae, with consequences for the entire food chain. Similarly, if the composition of riparian vegetation changes and non-native plants become more common than native plants, the macroinvertebrate community may shift as well. 

The best way to maintain and improve this Thanksgiving Feast for our aquatic life is to protect forests along streams, remove invasive species, and plant native trees along streams. Willistown Conservation Trust is working to enhance this feast at Ashbridge Preserve, where we have planted over 1000 trees along Ridley Creek. We hope that these trees will improve water quality and contribute much needed allochthonous input for the inhabitants of Ridley Creek.

By Anna Anna Willig | she/her | Watershed Conservation Associate | As part of our Watershed Protection Program, Anna assists with monthly water chemistry sampling, maintains the tree planting at Ashbridge Preserve, and analyzes water quality data from sampling and from our EnviroDIY sensors.

Filed Under: Amphibian conservation, Nature, Science, Watershed

Flooding 102

August 30, 2021 By Anna Willig

Flooding 102

Last week we looked at the basics of flooding, learning about what constitutes a flood and how floods are measured. This week, we wanted to dive deeper into flooding and explore the causes of floods and how flooding in our area looks different today than it did 20 years ago. If you didn’t get a chance to read our last article, check it out here. 

Where does flooding happen?

When we think about flooding, we are often concerned less by the amount of water moving through a stream and more by the land that becomes inundated with water. The area covered by water during a flood is called a floodplain. Floodplains tend to be flat, low-lying areas adjacent to streams and rivers. Not all floods will cover the entire floodplain, and some floods are large enough to reach areas above the usual floodplain. Since the size of a flood impacts the area that will be flooded, we can expect that a 100-year floodplain, the area that will be inundated during a 100-year flood, to be smaller than a 500-year floodplain. 

How much rain do you need to cause a flood? 

The amount of rain needed to cause a flood depends on many factors. The amount of rain that falls during a storm is not the same as the amount of water that reaches a stream. When water falls in a watershed, it can either be absorbed into the soil, a process called infiltration, or it can flow over the ground into the stream, a process called runoff. In general, more runoff leads to more flooding. 

A big factor that determines the amount of runoff from a rainfall event is the amount of impervious surface in a watershed, the area that feeds into a stream. An impervious surface is any feature that blocks water from infiltrating into the soil, such as buildings, roads, parking lots, driveways, sidewalks. Watersheds with lots of impervious surfaces will have more runoff than watersheds without impervious surfaces. Consequently, more water from a storm will reach the stream in watersheds with more impervious surface cover, causing greater flooding than if there were less impervious surface cover. 

Recent weather conditions also impact the amount of rain needed to cause a flood. Soils can only absorb so much water before they are saturated and cannot absorb any more. If a storm occurs after a few rainy days, when the soils are nearly saturated, less water will infiltrate and more water will run off, causing a larger flood than if the same storm occurred during a dry period. 

The rate of rainfall also impacts flooding. Storms that dump a few inches of rain in an hour will cause more flooding than storms that have the same amount of rain over several hours. Infiltration of rainwater into soil takes time, so more water will be able to infiltrate when a storm occurs over a longer period of time, resulting in less runoff and less flooding.

What is the difference between a flood and a flash flood?

Flash floods are a type of flood that occur quickly, within a few minutes to a few hours of a heavy rainfall. They are marked by a sudden increase in water level and are most common in developed areas with lots of impervious surfaces where there is little infiltration. Flash floods are generally considered the most dangerous type of flood because they can occur with little warning, leaving people little time to evacuate the floodplain.

It seems like we are having 100-year floods every year, why is that? 

In our last post, we discussed that a 100-year-flood was a flood that had a 1% chance of occurring in any given year. However, changes in our watersheds and in our climate are altering flood patterns in our area. 

The amount of impervious surface in a watershed is a major factor in determining how big a flood will be after any given rainstorm. As our area becomes more developed and more impervious surfaces are put in, it takes less and less rain to cause a flood. 

Climate change impacts the frequency and intensity of storms and resulting floods in our area. Researchers predict that a warming planet will cause larger and more frequent hurricanes to form in the Atlantic Ocean. While the brunt of the damage from these storms will be borne by coastal communities, we can expect to see more of these storms reaching our areas, leading to large floods such as those caused by Tropical Storm Isaias in 2020, Tropical Storm Sandy in 2012, Hurricane Irene in 2011, and most recently, Hurricane Ida.  

In addition to seeing the consequences of more severe coastal storms, our area is predicted to see an increase in annual precipitation by 2050. As a result, we can expect to have more intense storms more frequently. The increase in intensity and frequency of these storms, combined with the increase in impervious surfaces in our watersheds, means that what was once a 500-year flood may now be considered a 100-year flood and what was once a 100-year flood may now be a 50-year or a 20-year flood.

What is Willistown Conservation Trust doing to reduce flooding? What can I do?

Protecting land from development is one of the best ways to combat flooding. Land that is undeveloped allows far more infiltration than land that is developed, reducing the amount of runoff that reaches our streams after a rainstorm and the resultant floods. 

In addition, the Watershed Protection Program has planted over 800 trees along a floodplain at Ashbridge Preserve. Planting trees helps increase the amount of water that infiltrates into soil and will eventually reduce flooding downstream.

You can help too! Letting your grass grow a little taller before mowing is a great way to increase the amount of water that your yard can absorb, thereby reducing runoff. Adding a rain garden with native plants to your yard reduces the amount of water that runs off into streams. You could also add a rain barrel to your yard and collect rainwater for later use in your garden or elsewhere. Any action you take that reduces the amount of runoff reaching streams will make a difference in flooding for all those living downstream.

To learn even more about flooding, check out these resources:

  • See if you live in a floodplain using FEMA’s interactive Flood Map: FEMA Flood Map Service Center: Search By Address 
  • Learn more about the impacts of climate change on Pennsylvania: Pennsylvania Climate Impacts Assessment 2021
  • Explore how you can reduce runoff from your home: What You Can Do to Soak Up the Rain

Filed Under: Watershed

Flooding 101

August 23, 2021 By Anna Willig

As we approach the last few weeks of summer heat and humidity, we approach peak seasons for thunderstorms and flooding. Last Thursday, heavy rainfalls led to the first major flood of the year in our area. At Ashbridge Preserve, Ridley Creek rose over 2 meters (7 feet) in about 3 hours, pouring out of its banks. In the wake of these floods, we wanted to take the opportunity to answer some commonly asked questions about the fundamentals of flooding.

What is a flood?

The United States Geological Survey (USGS) defines a flood as “any relatively high streamflow overtopping the natural or artificial banks in any reach of a stream” (USGS, 2019). In other words, a flood happens when a stream breaches its banks, resulting in water flowing over areas that are not normally part of the stream. Floods can occur for a number of reasons, from snow melt to rain to changes in tides. In our area, the most common cause of flooding is rain, often from summer storms, and snow melt after large snowfalls.

Ridley Creek before (left) and during (left) a flood at Ashbridge Preserve in 2018. Photos by author.

How frequently do floods occur? 

Floods can occur several times a year, whenever rain or snowmelt causes a stream to overflow its banks. Small floods, when the stream barely breaches its banks, are more common than large floods when the water pours out of its banks.

The size of a flood is determined by the peak flow of a stream or the greatest amount of water moving through the stream during a flood event. Peak flow can be determined by measuring the height of a stream; it is the highest height during the flood event. Higher peak flows indicate larger floods and lower peak flows indicate smaller floods.

This graph shows water depth over time and nine floods that happened at Ashbridge Preserve in the Summer of 2018. The blue line represents the depth at which the stream completely fills its bank–a flood occurs any time the water rises above this depth. Each spike represents a rainstorm and the peak flow, which determines the size of a flood, is the highest depth in each storm. The star represents the peak flow of the flood that is pictured above.   

Floods are classified by how often we expect them to occur. A 100-year flood is a flood of a given size that has a 1% chance of occurring each year. Similarly, a 500-year flood has a 0.2% chance of occurring each year and a 1000-year flood has a 0.1% chance of occurring each year. However, this does not mean that a 100-year flood will only occur once every 100 years or that a 1000-year flood will occur once every 1000 years. It simply refers to the likelihood of such a flood happening each year. 

How do you stay safe during a flood?

Floods in our area can be dangerous, even life-threatening. According to a recently completed Hazard Risk Assessment by Chester County, flooding is the second highest risk hazard in the county. Floods can damage property, destroy roads and bridges, and threaten human lives. 

Floodwaters are most dangerous for drivers, especially when drivers try to cross flooded roads. Twelve inches of flowing water will move a car, and 2 feet of water will easily sweep a car away. Even just a few inches of water can immobilize a car, stranding drivers in the middle of a road. If you are driving during a rainstorm, do not drive through any floodwater. Floodwater is often dark and murky, making it difficult to judge how much water is actually on the road and if the water is flowing. Turn around and find another route or pull over and wait until the water goes down.

Want to learn more about flooding?

Stay tuned next week for Flooding 102, which takes a deeper dive into how land use decisions impact flooding in our area. Until then, check out some of these resources:

  • Monitor streams in Pennsylvania for real-time flooding: Streamflow conditions 
  • Check out real-time stream monitoring data in Ridley and Crum Creeks near Willistown: EnviroDIY Sensor Stations
  • Learn more about flood risk and historical flooding in Chester County: Risk Assessment – Flood, Flash Flood, Ice Jam
  • Learn more about how to stay safe during a flood: Turn Around Don’t Drown

USGS. (2019). Floods and Recurrence Intervals: Overview [Techniques and Methods]. USGS.
https://www.usgs.gov/special-topic/water-science-school/science/floods-and-recurrence-intervals?qt-science_center_objects=0#qt-science_center_objects

Filed Under: Conservation, Education, Land Protection, Science, Watershed Tagged With: pollution

OUR NATURE PRESERVES

Our nature preserves are open to the public 365 days per year from sunrise to sunset, providing natural places that offer peace and respite for all. Willistown Conservation Trust owns and manages three nature preserves in the Willistown area - Ashbridge, Kirkwood and Rushton Woods Preserve. We maintain these lands for the … Learn more about our nature preserves.

Upcoming Events

06 July
Rushton Farm

“Just Show Up” Volunteer Wednesdays at Rushton Farm

911 Delchester Rd, Newtown Square, PA

View Detail
06 July
Rushton Conservation Center

Workshop: Mindful Birding at Dusk

915 Delchester Road, Newtown Square, PA

View Detail
07 July

Stewardship Volunteer Thursdays

View Detail
No event found!
Load More

DONATE TODAY!

Invest in Nature! ENGAGE CONNECT SPONSOR LEAVE A LEGACY   If you would like to make a gift of securities, such as stocks, bonds, or mutual fund shares, please contact us at 610-353-2562 for instructions. For more information on … Donate Today

CONTACT

925 Providence Road
Newtown Square, PA 19073
(610) 353-2562
land@wctrust.org

OUR STORY

Willistown Conservation Trust's mission is to: "preserve and manage the open land, rural character, … read more

WHERE WE WORK

The work of the Willistown Conservation Trust is concentrated on 28,000 acres of Willistown Township … read more

JOIN OUR MAILING LIST

FAQs

Copyright © 2022 · WCTRUST.ORG