WILLISTOWN CONSERVATION TRUST

  • Facebook
  • Instagram
  • LinkedIn
  • YouTube
DONATE
  • About
    • HOW WE WORK
    • WHERE WE WORK
    • OUR STAFF AND TRUSTEES
    • JOBS & INTERNSHIPS
    • RUSHTON CONSERVATION CENTER
    • STRATEGIC PLAN
    • INCLUSION, ACCESS, AND BELONGING
    • FAQs
  • LATEST
    • BLOG
    • IN THE NEWS
    • PUBLICATIONS
    • PHOTOS
  • EDUCATION
    • GROUP EDUCATION
    • LAND PROTECTION
    • STEWARDSHIP
    • BIRD CONSERVATION
    • COMMUNITY FARM
    • WATERSHED PROTECTION
    • ECOCENTRIC EXPERIENCE
    • RUSHTON NATURE KEEPERS (RNK)
  • NATURE PRESERVES
    • ASHBRIDGE PRESERVE
    • HARTMAN MEADOW
    • KESTREL HILL PRESERVE
    • KIRKWOOD PRESERVE
    • RUSHTON WOODS PRESERVE
  • EVENTS
    • EVENT CALENDAR
    • BARNS & BBQ
    • RUN-A-MUCK
    • WILDFLOWER WEEK
    • ACCESS Program
  • Support
    • WAYS TO GIVE
    • SPONSOR THE TRUST
    • CORPORATE PARTNERSHIP PROGRAM
    • JOIN THE SYCAMORE SOCIETY
    • LEGACY SOCIETY & PLANNED GIVING
    • VOLUNTEER
    • DELCO GIVES 2026
  • OUR NEWEST PRESERVE
    • OUR NEWEST PRESERVE- KESTREL HILL

Watershed Holiday Gift Guide

December 20, 2022 By Watershed Protection Team

Check out some of our favorite watershed-themed gifts by clicking the photos to shop!

And don’t forget to shop local! Use this store locator to order these books from a bookshop near you.

Books for Kids & Adults

1. Over and Under the Pond by Kate Messner


2. Song of the Water Boatman & Other Pond Poems by Joyce Sidman


3. Eager: The Surprising, Secret Life of Beavers and Why They Matter by Ben Goldfarb


4. Beaver Land by Leila Philip


5. The Book of Eels by Patrik Svensson


Activities, Clothing, and Jewelry

1. Mayfly T-Shirts


2. Aquatic Insects Activity


3. Caddisfly Jewlery


4. Mayfly Onesies

Filed Under: Watershed

Help Keep our Drinking Water Clean by Reducing Salt Pollution

December 15, 2022 By Anna Willig

By WCT Conservation Research and Data Specialist Anna Willig
Cover Photo by Jennifer Mathes

Salt levels, often measured as chloride concentration, have increased dramatically in U.S. streams since the 1940s, when it became common practice in the U.S. to salt roads during winter storms. The Pennsylvania Department of Transportation applies over 800,000 tons of road salt per year to state roads in addition to a similar amount applied by municipalities and private citizens. These numbers add up to over 1.5 million tons of road salt applied per year in Pennsylvania alone, all of which eventually ends up in waterways. Though salt is naturally present in streams at trace concentrations due to the weathering of rocks and soils, the insects, fish, mussels, and amphibians that live in local waterways cannot tolerate the spikes in salt concentration that occur in winter.

Road salts threaten streams in two ways. During and after a winter storm, salt concentrations in streams can skyrocket as salty meltwater rushes in, creating conditions that are acutely toxic for fish and other stream creatures. Salts also build up in soils and in groundwater, slowly entering streams throughout the year and resulting in chronically elevated salt concentrations. Many stream organisms, particularly freshwater mussels, cannot tolerate these long-term increases in salt concentration and gradually disappear from streams.  

In the streams in the Willistown region, we have seen both acute spikes in salt concentration and evidence of chronic build-up through our monthly water quality monitoring program  in the headwaters of Ridley, Crum, and Darby Creeks. Chloride concentration, an indicator of salt pollution, is typically highest in winter months, with a notable spike occurring in February 2021. The spike in February 2021 was caused by snowmelt actively washing road salts into the streams. Chloride concentrations remain elevated throughout the year, often exceeding 50 mg/L, the maximum salt threshold that the most sensitive stream organisms can tolerate. 

Figure 1. Chloride concentration, an indicator of salt contamination, in the headwaters of Ridley, Crum, and Darby Creeks. All the red points indicate sample sites in Ridley Creek, the green points indicate sample sites in Crum Creek, and the blue points indicate a sample site in Darby Creek. 

Salt contamination in streams also harms human health and infrastructure. Road salt can end up in drinking water wells and water supplies and often is not removed by water treatments facilities. As salts move through the environment, they can pick up other pollutants along the way, further contaminating streams and drinking water. Salts also speed up the corrosion of metal pipes and concrete, shortening the lifespan of infrastructure. Similarly, overuse of salt rusts and corrodes cars, leading to expensive repairs. 

While road salt is necessary for safety, here are some ways to reduce salt pollution:

  • Shovel before applying salt. Even on cold days, the sun can still melt a thin layer of snow and may take care of the problem for you.
  • Do not use more than the recommended amount of salt. Only 1 mug full of salt, or 12 oz., is required to melt a 20-foot-long driveway. Read the instructions on your bag to see how much you need. 
  • If you feel crunching when you walk, you applied too much! Salt only works when it dissolves, so all the crystals that you feel crunching underfoot are not actually melting snow and ice. 
  • After the snow and ice have melted, sweep up any remaining salt! Save it and apply it during the next storm. 
  • Report large piles of salt on roads to your local municipality.
  • Share information about road salt and encourage your neighbors to use less!

To learn more about how to reduce salt pollution, check out these resources: 

  • “What You Can Do” 
  • “Save our Streams from Salt”

Filed Under: Education, Watershed

Capturing a Snapshot of Darby Creek

December 7, 2022 By Anna Willig

By WCT Conservation Research and Data Specialist Anna Willig 

At the beginning of November, the Watershed Protection Program at Willistown Conservation Trust (WCT) partnered with the Darby Creek Valley Watershed Association (DCVA) and, together, enlisted four volunteers to conduct a sampling “blitz” in the Darby Creek Watershed. With the help of our determined volunteers, we collected samples from 19 previously unstudied sites in two hours (Map 1). Once the volunteers collected the samples, everyone met at the Upper Main Line YMCA’s Artisan Village to analyze water quality and discuss the results. 

Our Team (from left to right): Charlie Coulter (volunteer), Anna Willig (WCT, author), Lauren McGrath, Michelle Lampley (UMLY), Deirdre Gordon (volunteer), Lloyd Cole (volunteer), Dale Weaver (volunteer), and Aurora Dizel (DCVA).

Darby Creek originates in small tributaries along the Route 30 corridor from Easttown to Ardmore which flow together as the stream makes its way towards John Heinz National Wildlife Refuge where it meets the Delaware River. Throughout its length, Darby Creek flows through many highly developed areas, picking up road salts, fertilizers, and other pollutants from lawns, parking lots, and roadways. 

Despite these threats to the health of the stream, few community science studies have been completed to understand the health of Darby Creek and all of its tributaries. To shed some light on the water quality in the Darby Creek Watershed, the Darby Creek Community Science Monitoring Program was launched in 2021 in partnership with DCVA and under the scientific guidance of Stroud Water Research Center. To date, volunteers have been trained to collect high quality water chemistry data at 15 sites throughout the entire watershed every four weeks. 

The sampling blitz, which covered 19 sites in the headwaters of Darby Creek, allowed us to gain even more information on water quality while controlling for weather conditions. Rain, heat, and other weather conditions can impact water quality measurements. By sampling at a single point in time, we can capture differences in water quality between sample sites rather than changes caused by time. Many of the sampling sites were located on small tributaries, allowing us to study how fine-scale differences in land use upstream of the sample site can impact water quality. 

One of the goals of the sampling blitz was to understand salt pollution in the headwaters of Darby Creek. Road salts applied in the winter end up in streams as snow and ice melt and flow into the nearest waterway. Salts can build up in groundwater and soils, resulting in long-term increases in salt concentration in streams, a phenomenon known as freshwater salinization. Freshwater salinization is occurring across North America, and increases in salt concentration threaten the fish, insects, mussels, and other organisms living in streams. By measuring salt concentration in November, before winter road salts are applied, we capture baseline concentrations that reflect long-term buildup of salts in soils and groundwater. 

The results of the sampling blitz indicate that salt pollution (as measured by chloride concentration) varied widely across the headwaters of Darby Creek. Chloride concentration ranged from 34 ppm to 230 ppm (Map 1). The lowest chloride concentration was measured at Site 19, a site located on Camp Run, a small tributary to Darby Creek. The area that drains into Camp Run is predominantly agricultural land, with some sections of limited residential development and forest. By contrast, chloride concentration was highest at Site 2, a site on an unnamed tributary. The land that drains into Site 2 is similar to the size of the Camp Run watershed, but is much more developed. The tributary originates near a SEPTA train station and flows under Route 30, picking up salt and contamination from residential and commercial developments. Identifying pollution hotspots, such as Site 2, can help determine areas that should be targeted for future restoration. 

Map 1. Sample sites in the headwaters of Darby Creek. Each point represents the approximate location of a sample site and is colored by the chloride concentration at that site. Low chloride concentrations are represented by pale yellow, with high chloride concentrations represented by a dark red. The red box indicates the sample area.

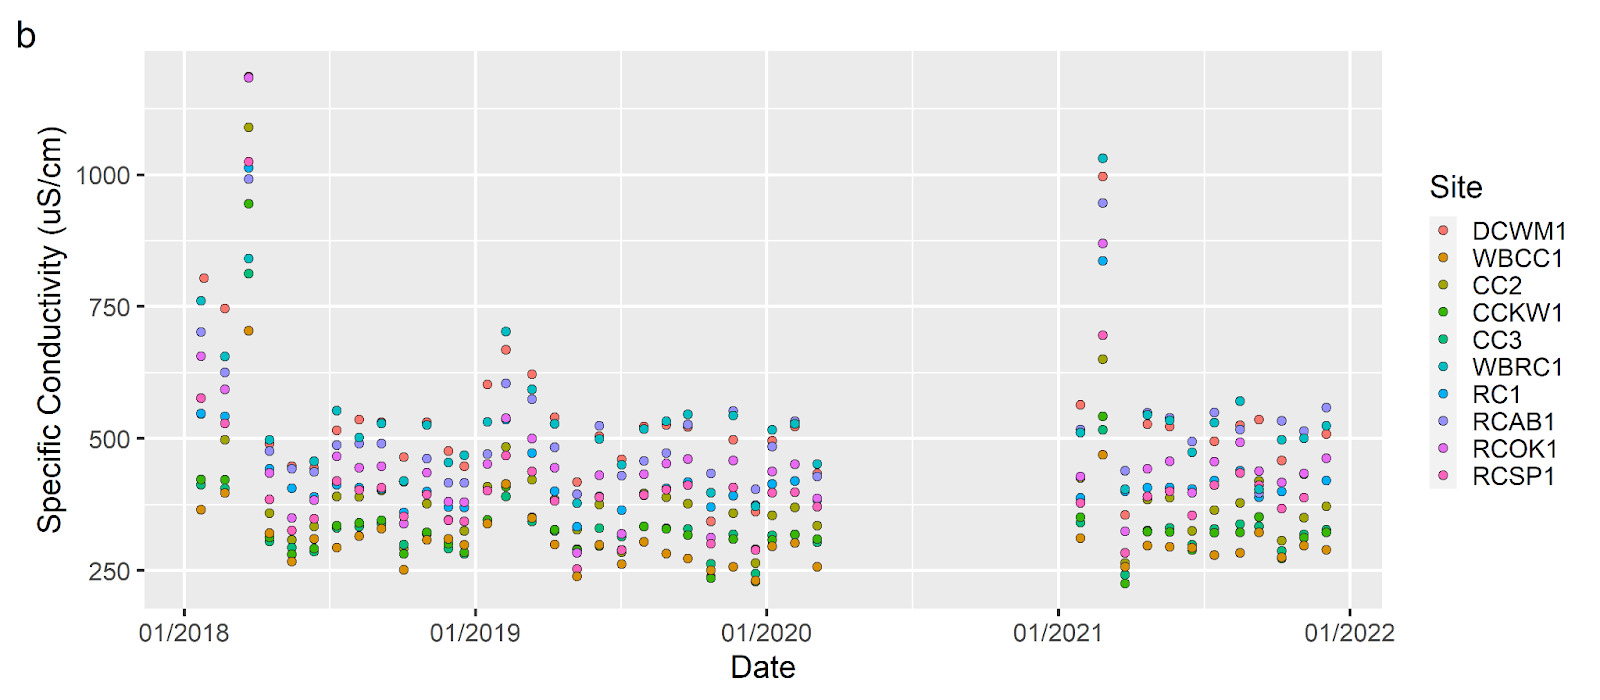
Another indicator of water quality that volunteers measured was specific conductivity, which reflects how well electricity can move through water. Pure water is a poor conductor and has a low conductivity. As more ions are added to the water — from pollutants such as salts, fertilizers, and heavy metals — conductivity increases. Conductivity also varied greatly between sites, ranging from 325 to 967 μS/cm. While a higher conductivity indicates a higher concentration of pollutants, it does not indicate the type of pollutant. When chloride (which is an ion that increases conductivity) is compared to conductivity at each site, we found that there is a strong relationship between the two measurements (shown by the trendline), indicating that salt pollution is the biggest driver of conductivity in the headwaters of Darby Creek (Figure 1). However, there are two sites, Site 1 and Site 9, that do not quite follow the relationship. Further research is needed to understand what is driving conductivity at these sites. To learn more about conductivity, check out the State of Our Streams Report. 

Figure 1. The relationship between chloride concentration and specific conductivity in the headwaters of Darby Creek. Each point represents a chloride concentration and specific conductivity measurement taken at a sample site. Points are colored by site. 

The results of the snapshot survey indicate that water quality is highly variable in the headwaters of Darby Creek. Sites that drain the highly-developed Route 30 corridor, such as Site 2 and Site 5, have relatively poor water quality, while sites that drain areas with more open space, such as Site 18 and Site 19, have much better water quality. The variability in water quality within a small section of the Darby Creek Watershed highlights the deep connection between local land use and stream health. Protecting areas of open space, especially in small tributaries, is crucial to maintaining and improving water quality throughout the entire watershed. 

Additionally, increasing awareness of threats to water quality, such as winter road salt application, can help to reduce the impact on local streams. To reduce road salt contamination in streams, avoid over applying salt and sweep up any salt that remains after snow and ice have melted. The salt can be reused for the next winter storm, saving money and helping improve water quality! 

This snapshot survey was a pilot for a larger survey WCT, DCVA, and Stroud Water Research Center are hoping to conduct in the spring. We are deeply grateful to the Upper Main Line YMCA for hosting this event and to our fantastic volunteers who were willing and eager to explore new sections of stream to collect this data. The snapshot survey would not have been possible without our partnerships with DCVA and Stroud Water Research Center. If you are interested in joining our community science program, please contact Lauren McGrath at lbm@wctrust.org. 

Filed Under: Conservation, Nature, Science, Volunteers, Watershed

Fish Shocking

November 29, 2022 By Lauren McGrath

On Saturday, October 22, the Watershed Protection Program joined scientists from the Academy of Natural Sciences of Drexel University’s Fisheries Team (ANS) to survey for fish in Ridley Creek at Ashbridge Preserve. It was a beautiful Saturday morning — crisp, bright, and perfect for learning more about the wildlife that calls Ridley Creek home! This event provided a unique opportunity to get a fish’s eye view of stream health, and it would not have been possible without the wonderful support of the talented Fisheries Team members Dr. David Keller and Paul Overbeck.

The morning started with a primer on fish survey protocols. Paul walked volunteers through the mechanics of electrofishing, a sampling technique where a small electric current is passed through the water to stun fish just long enough to be scooped up in a net and placed in a bucket. The scientists headed into Ridley Creek and began to survey, and immediately there was action in the water! 

As stunned fish began to fill the buckets, they were brought to shore and placed in aquariums to be studied. Within a short period of time, over 10 species of fish, crustaceans, and amphibians were documented. The Fisheries scientists quickly began to identify the wildlife and share what the presence of these creatures means for the ecosystem of Ridley Creek and surrounding landscape. Once the fish were observed in the aquariums, they were all safely released back into Ridley Creek. 

Included in the fishes that were identified was the American eel (Anguilla rostrata), a fish that migrates thousands of miles in its lifetime. This fish breeds in the Sargasso sea and migrates to headwater ecosystems — like at Ashbridge Preserve — where they can live over 25 years before completing their migration. The presence of this incredible fish showcases the connectivity of Ridley Creek with no large barriers to stop their movement to and from the Atlantic Ocean. American eel populations are declining due to large dams that block their migration, contribute to habitat loss, and overfishing of young eels.

Another fascinating fish present in the stream is the cutlip minnow (Exoglossum maxillingua). These fish are easy to identify up close, with a specially adapted three lobed, lower lip. These fish prefer gravel and rocky bottomed streams and are unable to thrive in polluted waterways where fine sediment buries rocky habitat. 

Black nose dace (Rhinichthys atratulus) are one of the most visibly common fishes in the headwaters of Ridley Creek and were abundant in the sample collected by ANS scientists! These fish are small, with big fish growing to be less than 4 inches long, but they school in shallow clear waters and can often be seen from the stepping stones at Ashbridge Preserve.

Fallfish (Semotilus corporalis) is the largest minnow native to eastern North America and they are abundant in the Ridley Creek headwaters! They are excellent targets for anglers, and their energetic behavior has earned them the nickname “freshwater tarpon.”

Rock Bass (Ambloplites rupestris) is well known to anglers as a sport fish, but this fish is actually an introduced species in Pennsylvania waterways! Since being introduced some time in the 1880s, they are actively stocked in waterways throughout the state.  

In addition to the fish that were sampled from Ridley Creek, ANS brought preserved specimens of fish of interest, including the northern snakehead (Channa argus), an aggressive invasive fish that has been spreading throughout the Delaware River watershed. 

This exciting and fascinating experience highlighted the importance of the ways that our activities on the landscape impacts the many lifeforms that call Ridley Creek home. The presence or absence of different species of fish can inform researchers of the health of Ridley Creek. There is a clear relationship with the development of the landscape and the decreasing health of freshwater ecosystems resulting in the loss of indicator species. As species disappear from the ecosystem, the entire system becomes weaker. As we head into a future that includes more frequent large storms, it is important that we focus on understanding how we can strengthen and improve the health of our systems to create resilience — the first step in this process is looking at who is present in the ecosystem. 

A huge thanks to the Fisheries Team for sharing their immense knowledge and skill! Click here to learn more about ongoing Fisheries research!

For more information on the research being conducted by the Watershed Protection Program and the lessons we have been learning about water quality in Ridley, Crum, and Darby Creeks, please explore the State of Our Streams Report.

— By Watershed Protection Program Director Lauren McGrath

Filed Under: Education, Science, Staff, Volunteers, Watershed

State of Our Streams Report Chapter 4: Alkalinity and Hardness

August 24, 2022 By Watershed Protection Team

By Anna Willig and Lauren McGrath | Willistown Conservation Trust Watershed Protection Program

Cover Photo by Jennifer Mathes

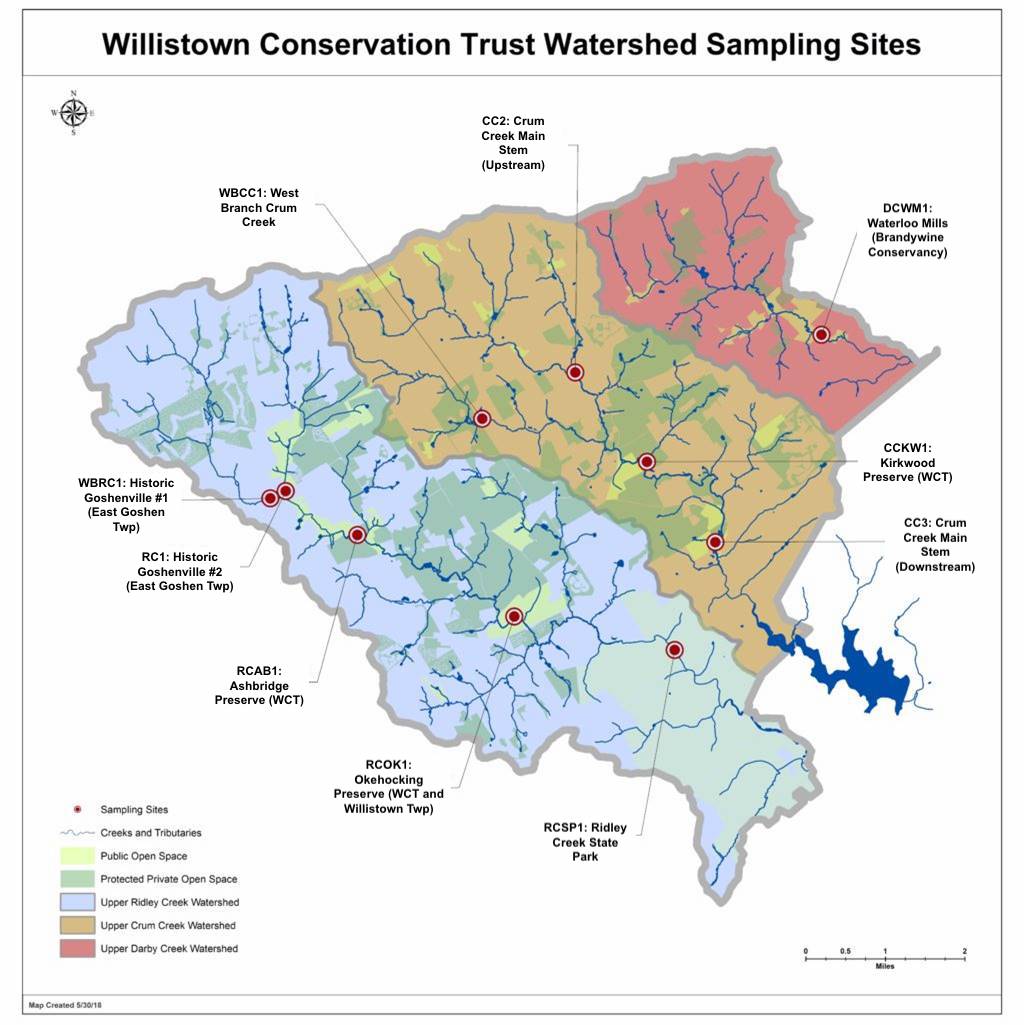
Since 2018, the Watershed Protection Program has monitored water quality at ten sample sites in the headwaters of Darby, Crum, and Ridley Creeks (Map 1). Every four weeks, the team visited each of the ten sites to take in-stream measurements and collect samples for analysis in the lab. We are proud to present our findings on water quality based on analysis of our data collected from 2018 through 2021, which includes 41 monitoring visits and over 7500 different measurements. 

August is National Water Quality month, and each week we will publish excerpts from one chapter from our report. Last week, Chapter 3 focused on specific conductivity, chlorides, and nutrients. If you missed the introduction to water chemistry, visit Chapter 1, or the primer on physical stream characteristics, see Chapter 2. This week, we are focusing on alkalinity and hardness. The full report, which includes more information than is provided in the blog posts, can be found here. 

Two final parameters that enhance our understanding of water quality are alkalinity and hardness. Alkalinity measures the ability of water to neutralize acidic compounds and resist changes in pH. Higher alkalinity indicates a greater ability to resist pH changes from pollutants such as wastewater effluent, protecting stream life from acidic or basic environments. Hardness is the concentration of calcium and magnesium ions in the water. Hard water has high concentrations of these ions and is generally more of a nuisance than a health concern for humans or stream life. When water is hard, it can leave behind residue on pipes, potentially leading to lower water pressure or clogging. 

Alkalinity and hardness both remain within acceptable levels for waterways in this region. Alkalinity and hardness are significantly higher in Darby Creek than in Crum and Ridley Creeks. This is most likely due to differences in regional geology, as alkalinity and hardness are primarily affected by the types of rocks and soils that water flows through. However, weathering of man-made materials, particularly concrete, can alter these parameters, and any sudden changes should be investigated. 

For a primer on statistical tests and how to read boxplots and scatterplots, click here.

Alkalinity

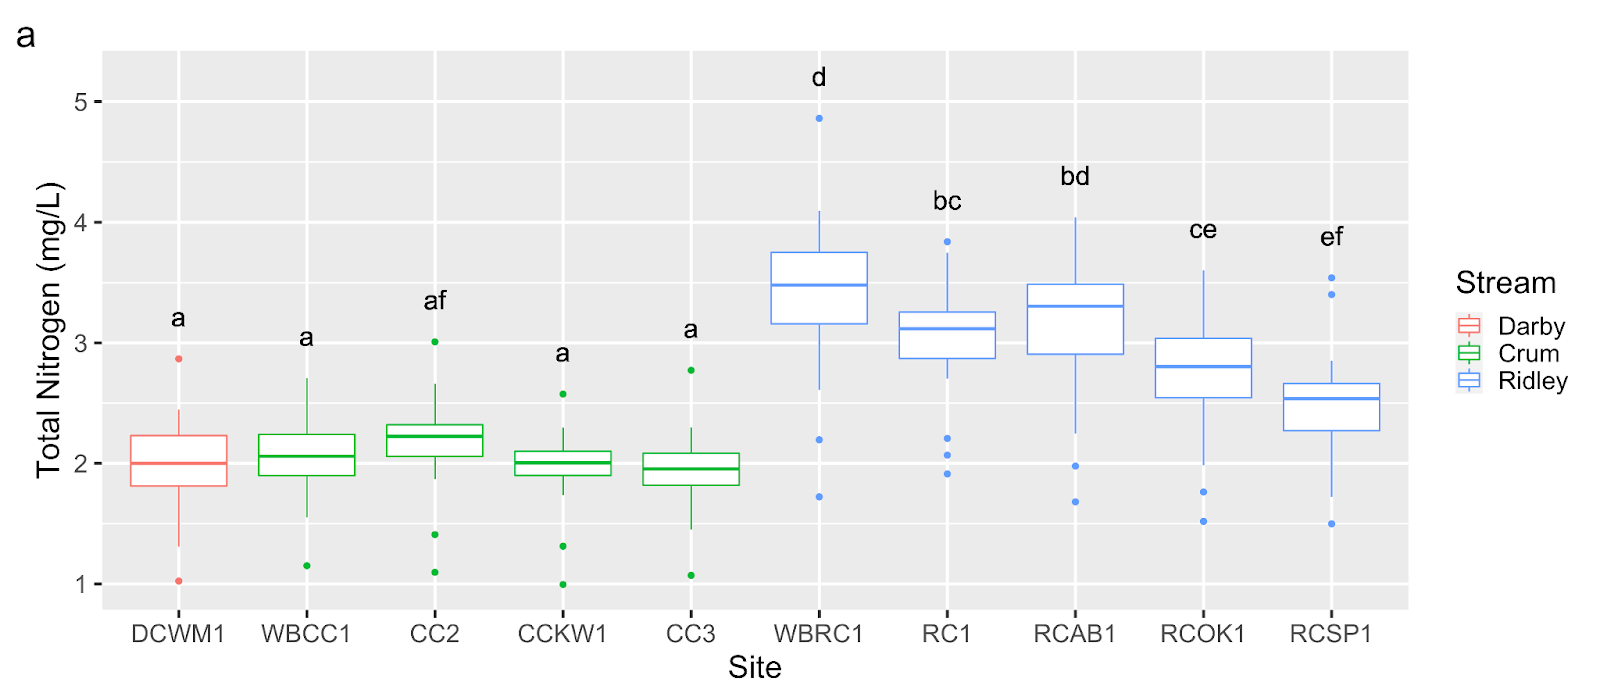
Figure 1. Alkalinity from January 2018 through December 2021 (a) across ten sample sites in the headwaters of the Darby, Crum, and Ridley Creeks and (b) over time.

Alkalinity, analyzed quarterly, measures the ability of a body of water to resist changes in pH; higher alkalinity denotes a greater ability to resist pH changes.1 Local geology tends to be the primary driver of alkalinity, though accelerated weathering of natural materials and weathering of man-made materials, namely concrete, increases alkalinity.2 Alkalinity remains above the Pennsylvania Department of Environmental Protection minimum of 20.0 mg/L at all sites.3 

There are significant differences in alkalinity between sites. Alkalinity is significantly higher at Darby Creek at Waterloo Mills (DCWM1) than at all other sites (Figure 1a). Alkalinity does not vary significantly with Crum Creek, but within Ridley Creek, alkalinity is significantly lower at West Branch Ridley Creek (WBRC1) than at Ridley Creek at Okehocking Preserve (RCOK1) (Figure 1a). 

Hardness

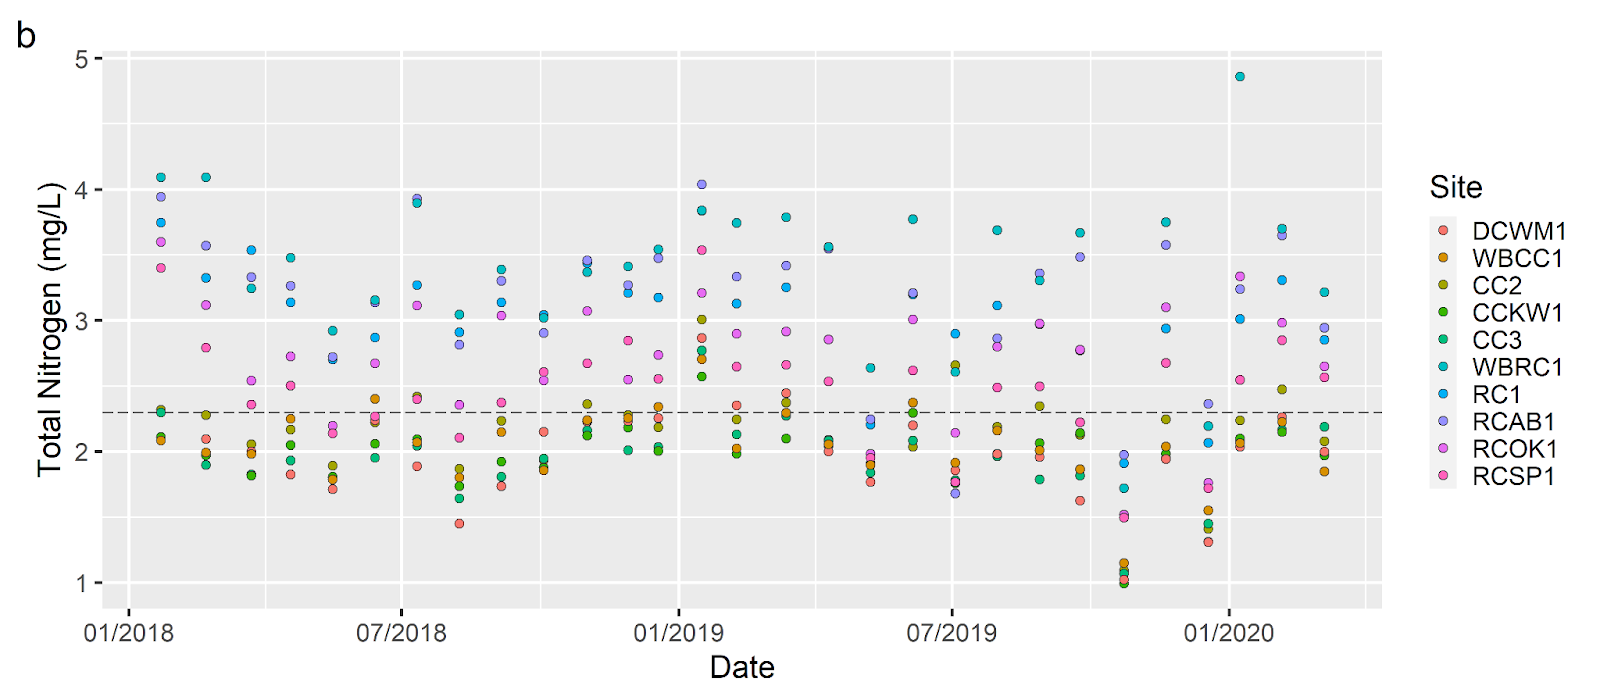
Figure 2. Hardness from January 2018 through March 2021 (a) across ten sample sites in the headwaters of the Darby, Crum, and Ridley Creeks and (b) over time.

Hardness, analyzed quarterly, is the concentration of dissolved calcium and magnesium ions in water.4 Hardness is primarily governed by the geology of a region; water dissolves calcium and magnesium as it flows through rocks and soils. Based on standards from the United States Geological Survey, water in Crum Creek is moderately hard, water in Ridley Creek ranges from moderately hard to hard, and water in Darby Creek is hard.4

There are significant differences in hardness between sites. Hardness is significantly higher at DCWM1 than at all sites besides WBRC1 (Figure 2a). Hardness varies significantly within Ridley Creek but not within Crum Creek (Figure 2a). There is little seasonal variation in hardness (Figure 2b).

Key Takeaways

  • Alkalinity is high enough at all sample sites to protect stream life from rapid changes in pH.
  • Water ranges from moderately hard to hard within the sample area. This does not pose any risk to stream life. 
  • Differences in alkalinity and hardness between sites are likely due to differences in regional geology. No actions are needed to alter alkalinity and hardness.

To read the full “State of our Streams Report,” click here.

Map 1. Willistown Conservation Trust’s sampling sites. Five sample locations are within the Ridley Creek watershed, four are within the Crum Creek Watershed, and one is within the Darby Creek Watershed. Sampling was conducted at each site every four weeks from January 2018 through December 2021.

Funding 

This report was made possible through a grant from the William Penn Foundation. The WIlliam Penn Foundation, founded in 1945 by Otto and Phoebe Haas, is dedicated to improving the quality of life in the Greater Philadelphia region through efforts that increase educational opportunities for children from low-income families, ensure a sustainable environment, foster creativity that enhances civic life, and advance philanthropy in the Philadelphia region. In 2021, the Foundation will grant more than $117 million to support vital efforts in the region. 

The opinions expressed in this report are those of the author(s) and do not necessarily reflect the views of the William Penn Foundation. 

References

1. United States Geological Survey. Alkalinity and Water. Water Science School https://www.usgs.gov/special-topic/water-science-school/science/alkalinity-and-water?qt-science_center_objects=0#qt-science_center_objects (2018).

2. Kaushal, S. S. et al. Human-accelerated weathering increases salinization, major ions, and alkalinization in fresh water across land use. Appl. Geochem. 83, 121–135 (2017).

3. Pennsylvania Department of Environmental Protection. 25 Pa. Code Chapter 93. Water Quality Standards § 93.7. Specific Water Quality Criteria. http://www.pacodeandbulletin.gov/Display/pacode?file=/secure/pacode/data/025/chapter93/chap93toc.html&d=reduce (2020).

4. United States Geological Survey. Hardness of Water. Water Science School https://www.usgs.gov/special-topic/water-science-school/science/hardness-water?qt-science_center_objects=0#qt-science_center_objects (2018).

— By Anna Willig and Lauren McGrath | Willistown Conservation Trust Watershed Protection Program

Filed Under: Education, Science, Watershed

  • « Previous Page
  • 1
  • 2
  • 3
  • 4
  • 5
  • 6
  • …
  • 14
  • Next Page »

CONTACT

925 Providence Road
Newtown Square, PA 19073
(610) 353-2562
land@wctrust.org

501(c)(3) EIN 23-2841453

JOIN OUR MAILING LIST

Copyright © 2026 · WCTRUST.ORG