By: CJ Chen, Spring 2024 Watershed Team High School Intern
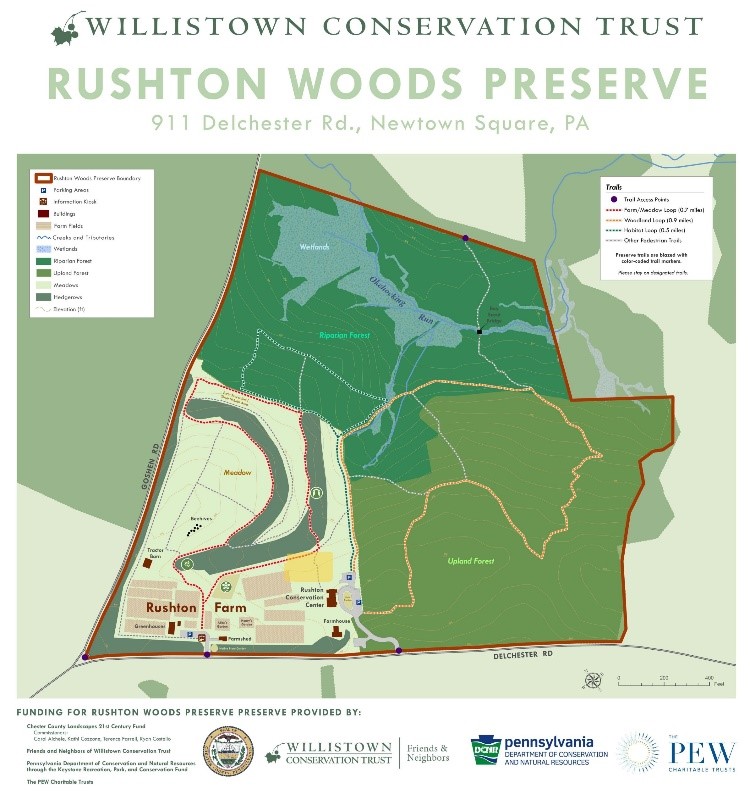
From going out to nature preserves and injecting trees with pesticide, to wading through creeks knee-deep and flipping over rocks to find macroinvertebrates, each week at Willistown brought something new. As a high school intern on the Watershed Protection Program team this spring, I saw how a non-profit conservation group functions and what it’s like to be a real-life scientist. I got to experience field work during monthly sampling days, lab work to process those samples, and the many meetings that facilitate collaboration with the community. I learned that watershed science involves a lot more than just water, it encompasses the many overlapping pieces of environmental studies.
Through real-world experience, I’ve learned much more than I would have in a traditional classroom setting, preparing me well for my future endeavors as I continue my studies at Haverford College in the fall. Moreover, I was able to apply what I learned at Willistown to an independent project at a local park, in which I completed a study, summarized below.
The project assesses the water quality of Little Crum Creek that passes through Little Crum Creek Park (est. 1970) in Swarthmore Borough, PA. Little Crum Creek is a small stream beginning in Swarthmore, flowing 3.68 miles1 before joining Crum Creek and entering the Delaware River (Map 1a and 1b).
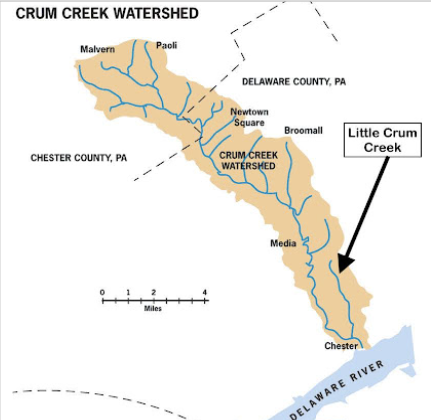
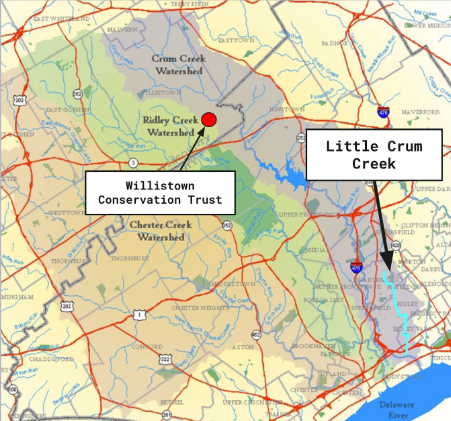
Upstream waterways like Little Crum Creek carry contamination and affect the quality of downstream waters. Thus, Little Crum Creek impacts the health of the Delaware River, a crucial drinking water source for 17 million people across five states.
Land usage affects the health of the waterways; stream pollution increases as open space diminishes due to land development. The area surrounding Little Crum Creek is heavily developed for retail and residential purposes. Because water cannot soak into the impervious surfaces found in these developed areas–e.g. roadways, parking lots, sidewalks, and rooftops–large volumes of stormwater runoff are channeled through drains, which then end up in streams like Little Crum Creek.
Since 1971, Little Crum Creek has been designated as an impaired stream, meaning it does not fulfill federal water quality standards. Understanding the current health of the creek will allow for further improvements in the stream quality to be made by Friends of Little Crum Creek Park and Swarthmore Borough.
Three complete water tests were conducted from March to May using low-cost Lamotte brand kits. While many parameters were assessed, the most important findings are listed below.
Water temperature influences the ability of salts and oxygen to dissolve in the stream, and many organisms require consistent water temperatures to survive. As rain falls on impervious surfaces like pavement, the water heats up under the sun and channels through drains and sewers into the creek. High temperatures usually reflect that the surrounding landscape has a high percentage of impervious surfaces. In Swarthmore, most of the landscape is heavily developed which is reflected at Little Crum Creek with its elevated water temperatures that exceed acceptable levels established by the state across all three samplings in the park.
Chloride and specific conductivity (SPC) together assess the salt concentration. High concentrations of salts harm aquatic organisms, causing deformities in fish and amphibians and killing sensitive keystone organisms like mussels. Salt most often originates from human activity such as excessive road salting. It was found that Little Crum Creek has a salt issue originating from the unnamed tributary. Further continual study of the elevated salts is needed to determine the exact source in the unnamed tributary.
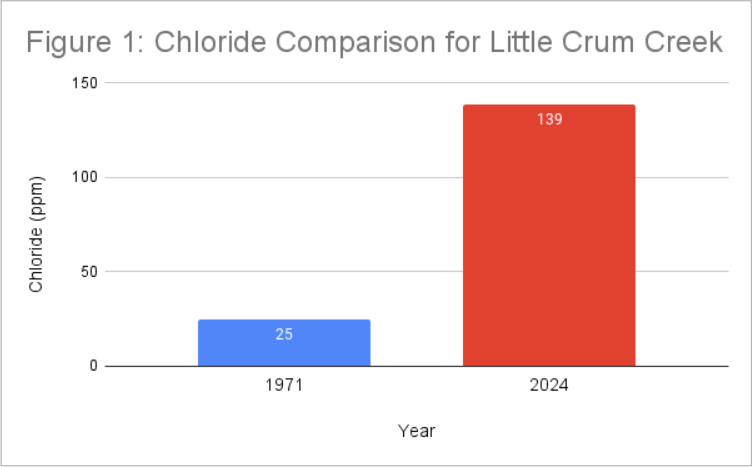
The high salt levels of Little Crum Creek follow the rising national trend of oversalting roadways. This is seen when the chloride levels found in this study are compared to the water quality data from a 1971 United States Geological Survey (Fig. 1).
These issues may be lessened by planting native streamside vegetation, which will address elevated stream temperature and provide a buffer between the stormwater runoff and the creek. Additionally, reducing road salting in the winter and fertilizing lawns at least 48 hours before rain (if at all), are easy community-led steps to reduce the contamination in Little Crum Creek.
Interested in learning more about Little Crum Creek? Click here to read the full report!
1McGarity, Arthur. Watershed Assessment of the Lower Crum Creek: Decision Support for a Community-Based Partnership. Swarthmore College, 2001. Web. <https://www.swarthmore.edu/NatSci/watershed/319_Project/Full_319_Report.pdf>.