WILLISTOWN CONSERVATION TRUST

  • Facebook
  • Instagram
  • Twitter
  • YouTube
GIVE
  • About
    • HOW WE WORK
    • WHERE WE WORK
    • DIVERSITY, EQUITY & INCLUSION STATEMENT
    • OUR STAFF AND TRUSTEES
    • OUR NATURE PRESERVES
    • JOBS & INTERNSHIPS
    • STRATEGIC PLAN
    • FAQs
  • LATEST
    • BLOG
    • PUBLICATIONS
    • IN THE NEWS
    • PHOTOS
  • PROGRAMS
    • BIRD CONSERVATION
    • COMMUNITY FARM
    • EDUCATION
    • LAND PROTECTION
    • STEWARDSHIP
      • TRAILS
    • WATERSHED PROTECTION
  • EVENTS
    • EVENT CALENDAR
    • BARNS & BBQ
    • RUN-A-MUCK
    • WILDFLOWER WEEK
    • PLASTIC FREE JULY
    • RUSHTON NATURE KEEPERS (RNK)
  • Support
    • SPONSOR THE TRUST
      • CORPORATE PARTNERSHIP PROGRAM
    • JOIN THE SYCAMORE SOCIETY
    • LEGACY SOCIETY & PLANNED GIVING
    • CAMPAIGN FOR RUSHTON WOODS PRESERVE
    • WAYS TO GIVE
    • VOLUNTEER
    • OUR SUPPORTERS
  • Rushton Conservation Center

Capturing a Snapshot of Darby Creek

December 7, 2022 By Anna Willig

By WCT Conservation Research and Data Specialist Anna Willig 

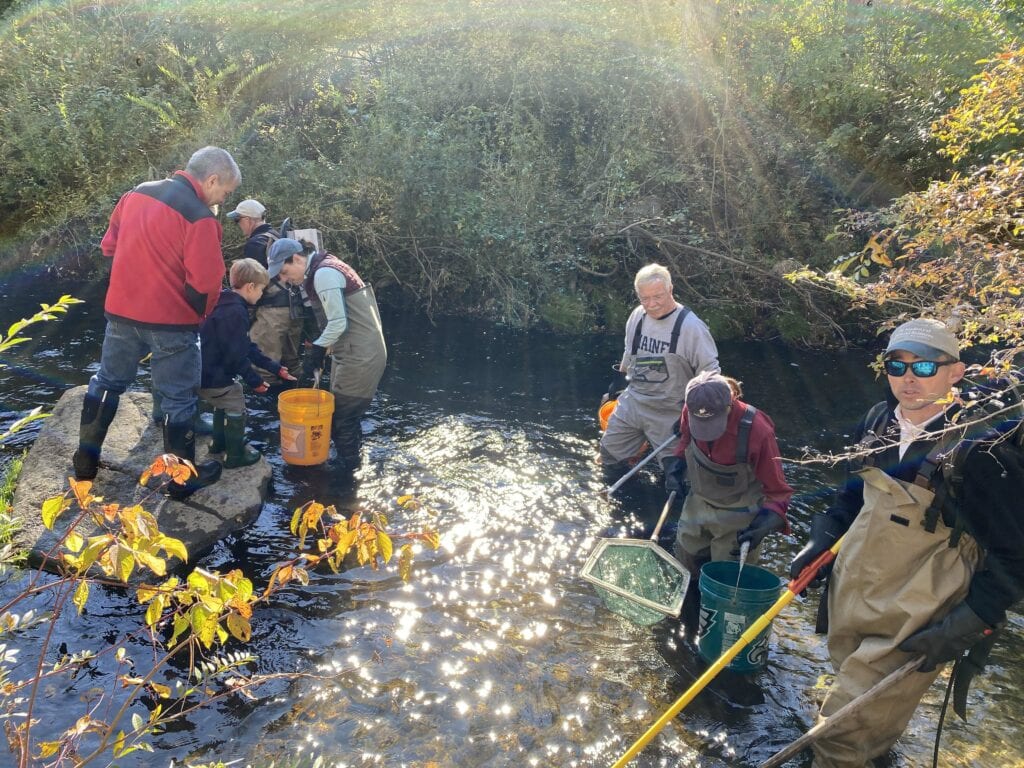
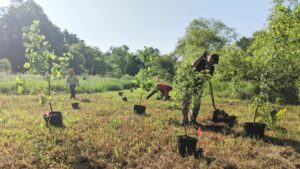
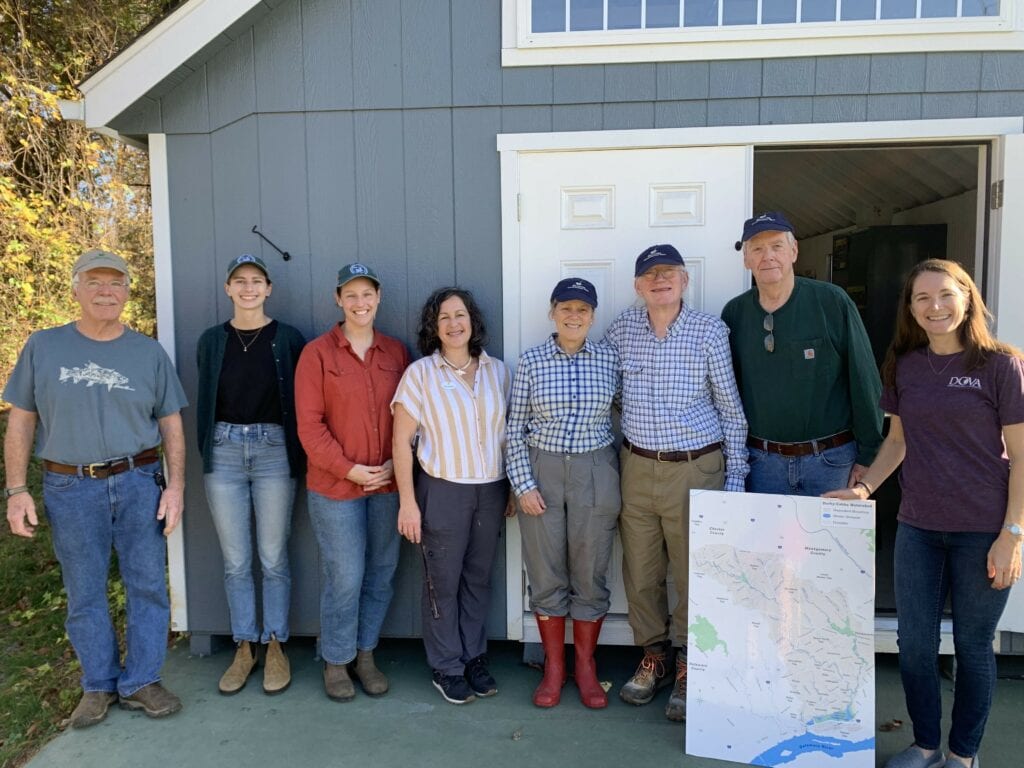
At the beginning of November, the Watershed Protection Program at Willistown Conservation Trust (WCT) partnered with the Darby Creek Valley Watershed Association (DCVA) and, together, enlisted four volunteers to conduct a sampling “blitz” in the Darby Creek Watershed. With the help of our determined volunteers, we collected samples from 19 previously unstudied sites in two hours (Map 1). Once the volunteers collected the samples, everyone met at the Upper Main Line YMCA’s Artisan Village to analyze water quality and discuss the results. 

Our Team (from left to right): Charlie Coulter (volunteer), Anna Willig (WCT, author), Lauren McGrath, Michelle Lampley (UMLY), Deirdre Gordon (volunteer), Lloyd Cole (volunteer), Dale Weaver (volunteer), and Aurora Dizel (DCVA).

Darby Creek originates in small tributaries along the Route 30 corridor from Easttown to Ardmore which flow together as the stream makes its way towards John Heinz National Wildlife Refuge where it meets the Delaware River. Throughout its length, Darby Creek flows through many highly developed areas, picking up road salts, fertilizers, and other pollutants from lawns, parking lots, and roadways. 

Despite these threats to the health of the stream, few community science studies have been completed to understand the health of Darby Creek and all of its tributaries. To shed some light on the water quality in the Darby Creek Watershed, the Darby Creek Community Science Monitoring Program was launched in 2021 in partnership with DCVA and under the scientific guidance of Stroud Water Research Center. To date, volunteers have been trained to collect high quality water chemistry data at 15 sites throughout the entire watershed every four weeks. 

The sampling blitz, which covered 19 sites in the headwaters of Darby Creek, allowed us to gain even more information on water quality while controlling for weather conditions. Rain, heat, and other weather conditions can impact water quality measurements. By sampling at a single point in time, we can capture differences in water quality between sample sites rather than changes caused by time. Many of the sampling sites were located on small tributaries, allowing us to study how fine-scale differences in land use upstream of the sample site can impact water quality. 

One of the goals of the sampling blitz was to understand salt pollution in the headwaters of Darby Creek. Road salts applied in the winter end up in streams as snow and ice melt and flow into the nearest waterway. Salts can build up in groundwater and soils, resulting in long-term increases in salt concentration in streams, a phenomenon known as freshwater salinization. Freshwater salinization is occurring across North America, and increases in salt concentration threaten the fish, insects, mussels, and other organisms living in streams. By measuring salt concentration in November, before winter road salts are applied, we capture baseline concentrations that reflect long-term buildup of salts in soils and groundwater. 

The results of the sampling blitz indicate that salt pollution (as measured by chloride concentration) varied widely across the headwaters of Darby Creek. Chloride concentration ranged from 34 ppm to 230 ppm (Map 1). The lowest chloride concentration was measured at Site 19, a site located on Camp Run, a small tributary to Darby Creek. The area that drains into Camp Run is predominantly agricultural land, with some sections of limited residential development and forest. By contrast, chloride concentration was highest at Site 2, a site on an unnamed tributary. The land that drains into Site 2 is similar to the size of the Camp Run watershed, but is much more developed. The tributary originates near a SEPTA train station and flows under Route 30, picking up salt and contamination from residential and commercial developments. Identifying pollution hotspots, such as Site 2, can help determine areas that should be targeted for future restoration. 

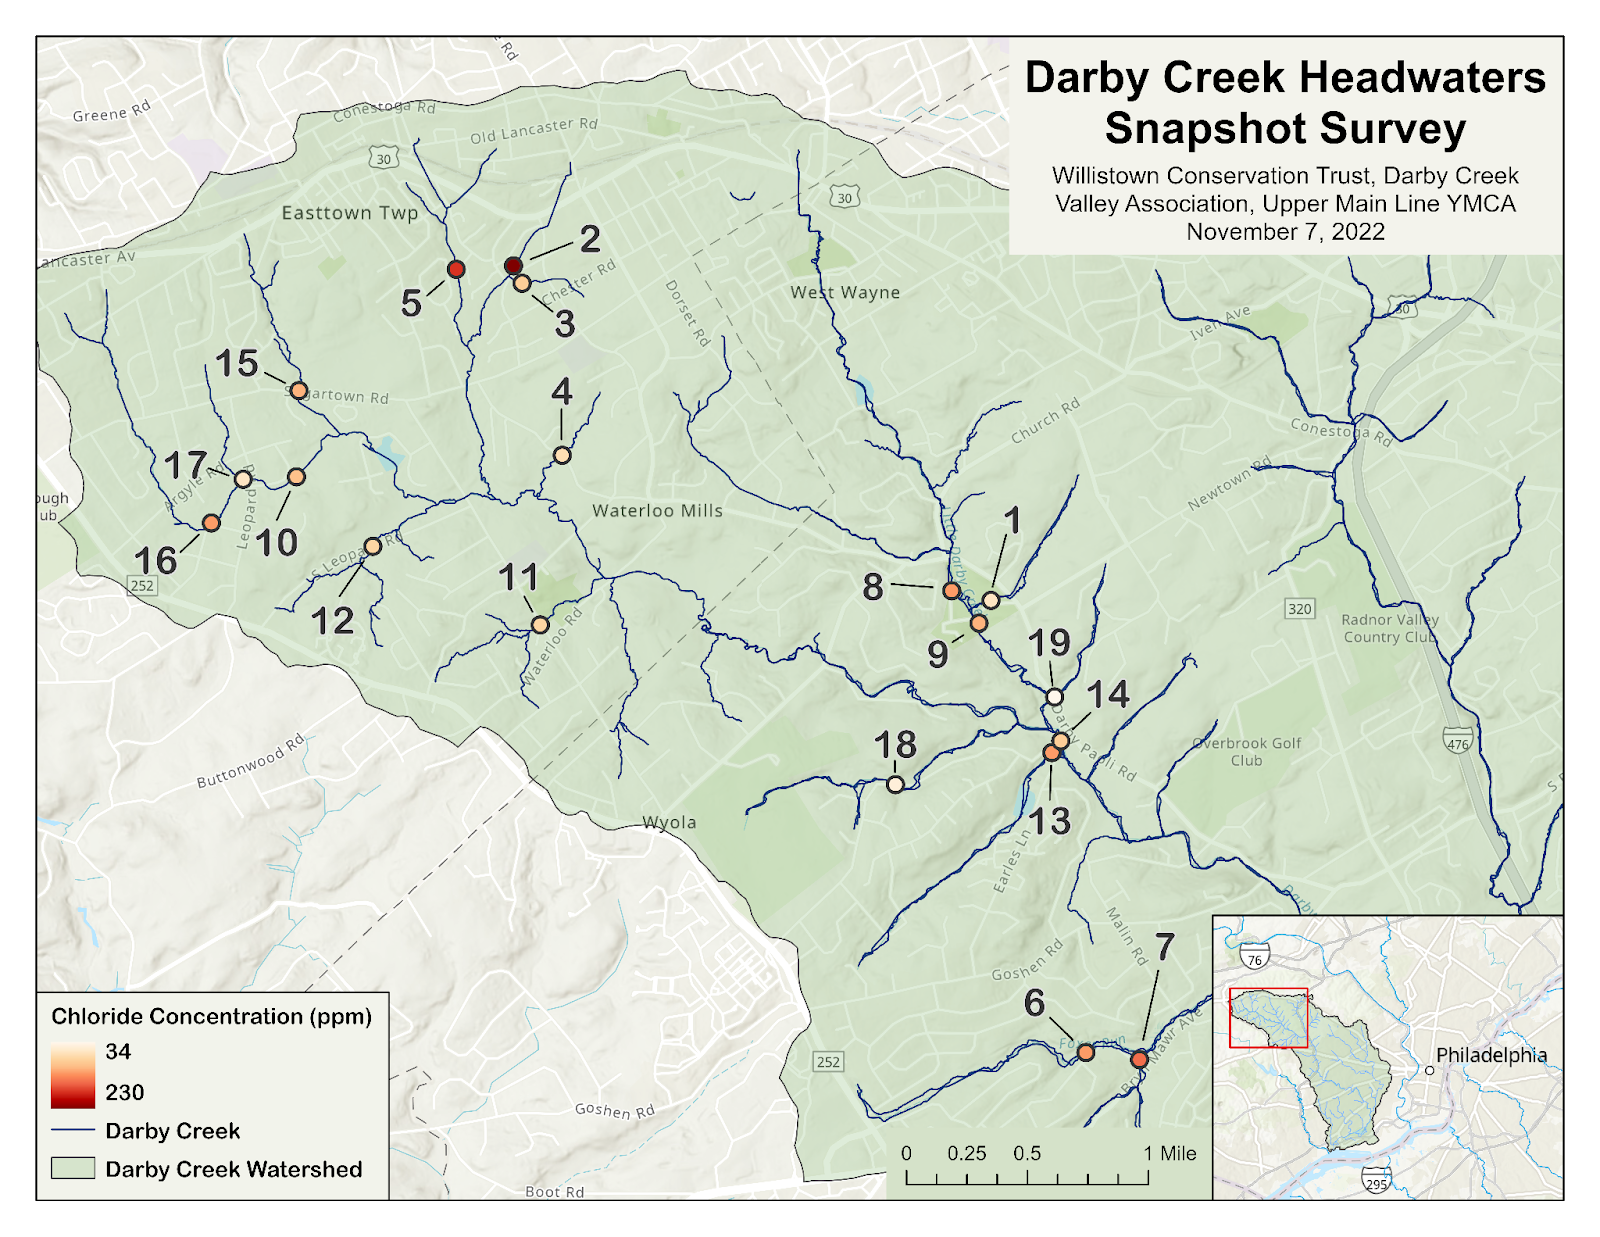
Map 1. Sample sites in the headwaters of Darby Creek. Each point represents the approximate location of a sample site and is colored by the chloride concentration at that site. Low chloride concentrations are represented by pale yellow, with high chloride concentrations represented by a dark red. The red box indicates the sample area.

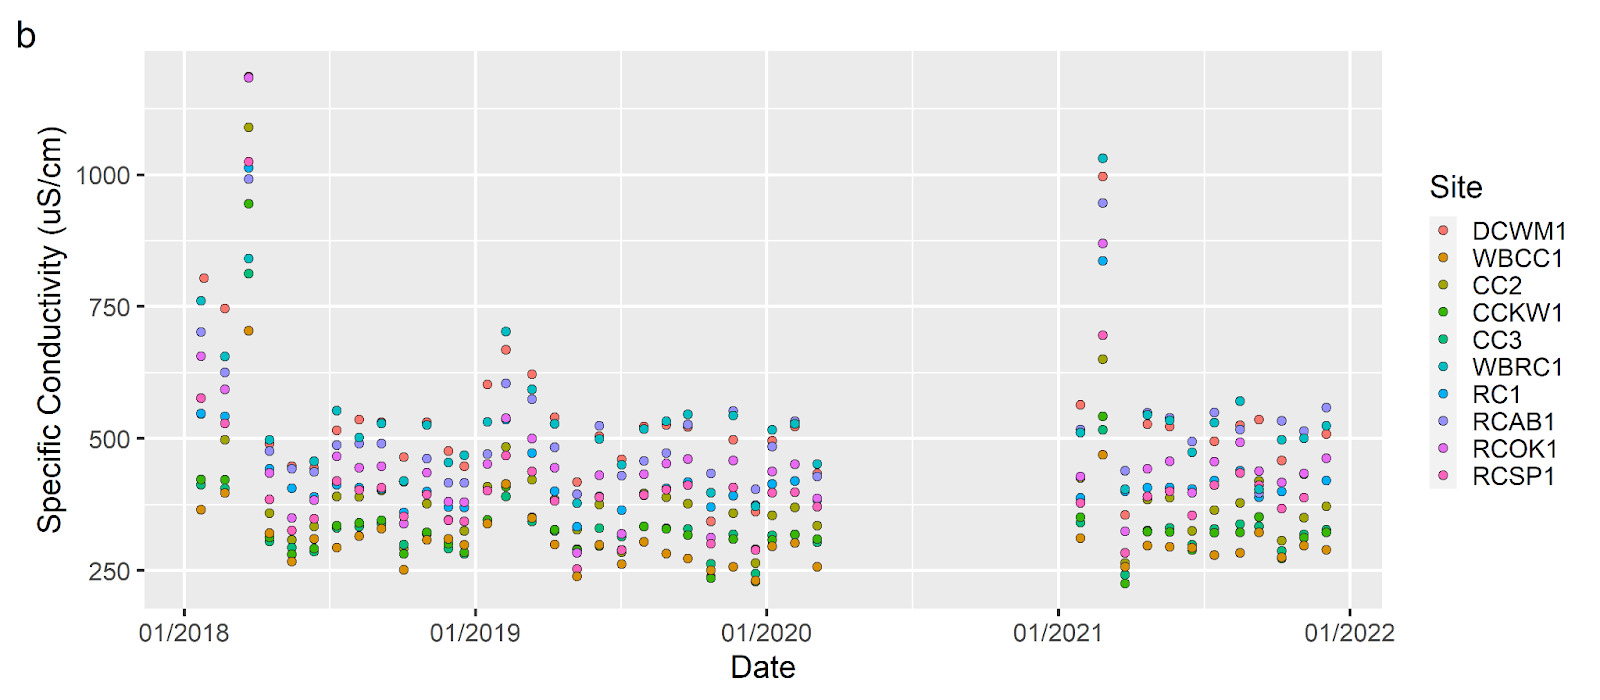
Another indicator of water quality that volunteers measured was specific conductivity, which reflects how well electricity can move through water. Pure water is a poor conductor and has a low conductivity. As more ions are added to the water — from pollutants such as salts, fertilizers, and heavy metals — conductivity increases. Conductivity also varied greatly between sites, ranging from 325 to 967 μS/cm. While a higher conductivity indicates a higher concentration of pollutants, it does not indicate the type of pollutant. When chloride (which is an ion that increases conductivity) is compared to conductivity at each site, we found that there is a strong relationship between the two measurements (shown by the trendline), indicating that salt pollution is the biggest driver of conductivity in the headwaters of Darby Creek (Figure 1). However, there are two sites, Site 1 and Site 9, that do not quite follow the relationship. Further research is needed to understand what is driving conductivity at these sites. To learn more about conductivity, check out the State of Our Streams Report. 

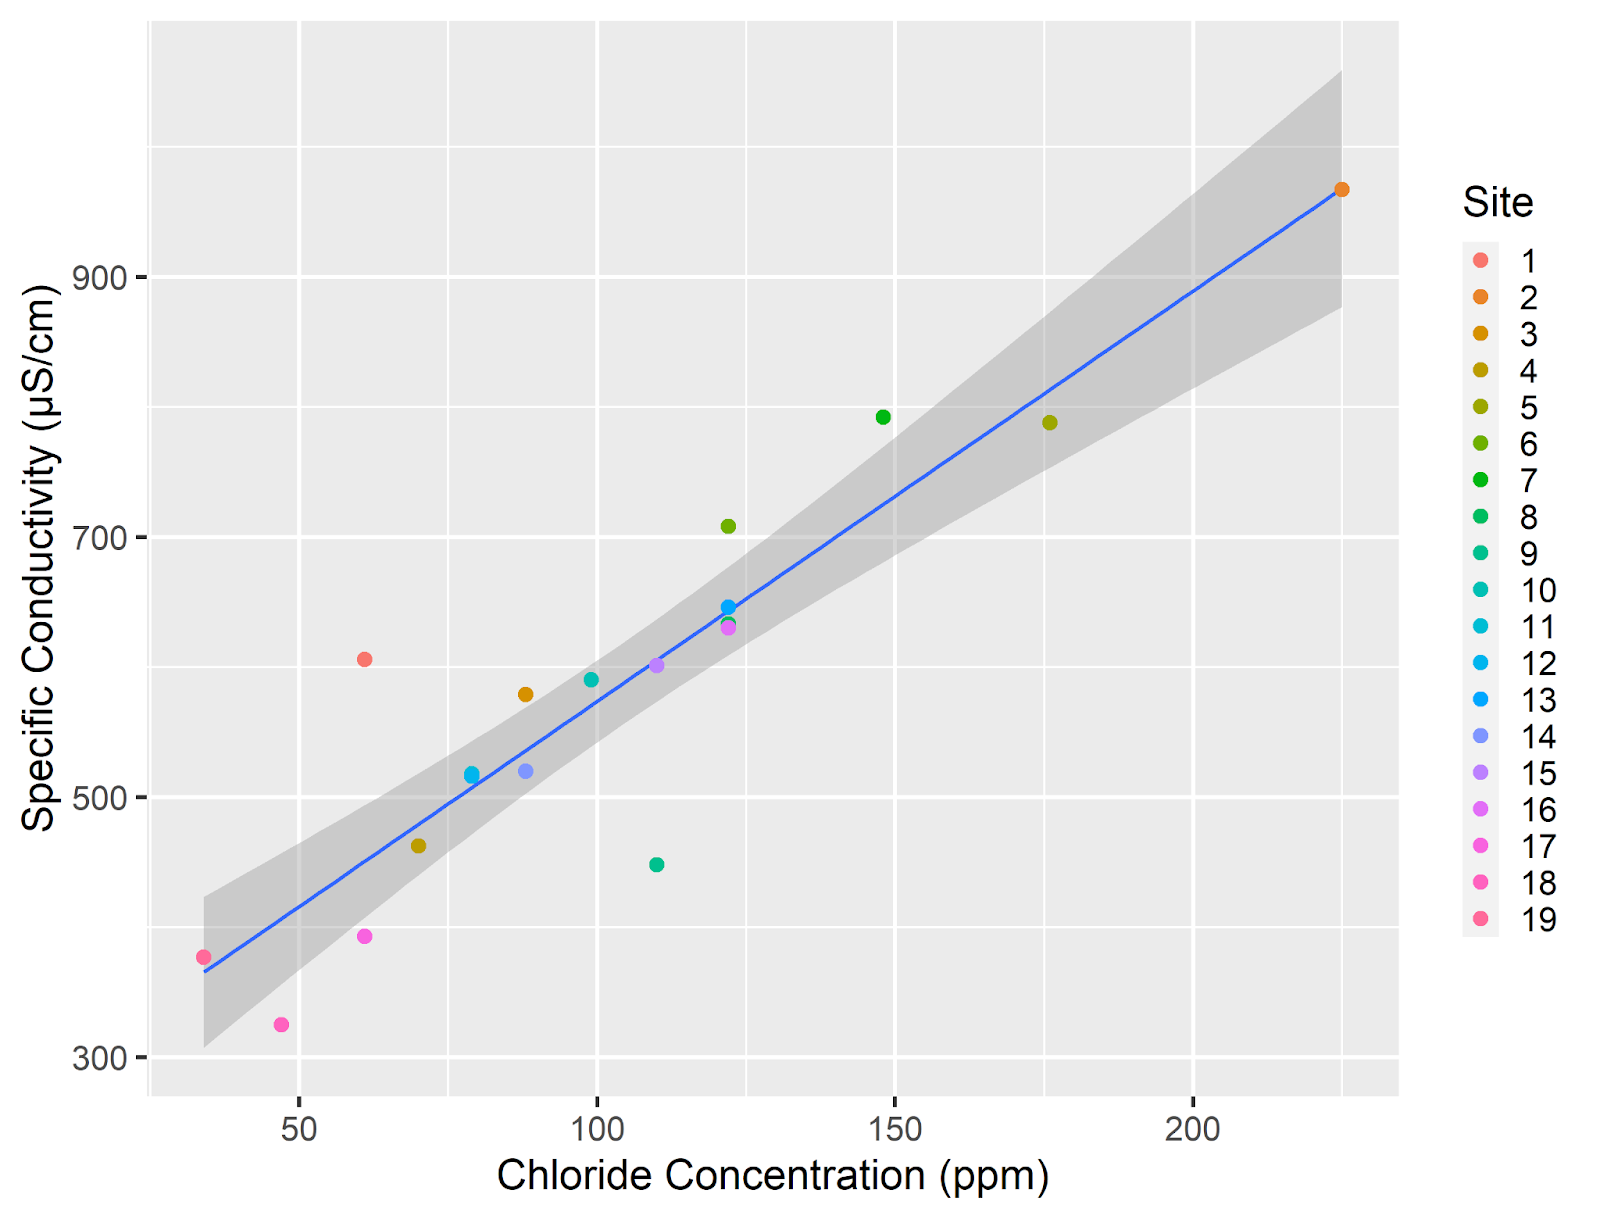
Figure 1. The relationship between chloride concentration and specific conductivity in the headwaters of Darby Creek. Each point represents a chloride concentration and specific conductivity measurement taken at a sample site. Points are colored by site. 

The results of the snapshot survey indicate that water quality is highly variable in the headwaters of Darby Creek. Sites that drain the highly-developed Route 30 corridor, such as Site 2 and Site 5, have relatively poor water quality, while sites that drain areas with more open space, such as Site 18 and Site 19, have much better water quality. The variability in water quality within a small section of the Darby Creek Watershed highlights the deep connection between local land use and stream health. Protecting areas of open space, especially in small tributaries, is crucial to maintaining and improving water quality throughout the entire watershed. 

Additionally, increasing awareness of threats to water quality, such as winter road salt application, can help to reduce the impact on local streams. To reduce road salt contamination in streams, avoid over applying salt and sweep up any salt that remains after snow and ice have melted. The salt can be reused for the next winter storm, saving money and helping improve water quality! 

This snapshot survey was a pilot for a larger survey WCT, DCVA, and Stroud Water Research Center are hoping to conduct in the spring. We are deeply grateful to the Upper Main Line YMCA for hosting this event and to our fantastic volunteers who were willing and eager to explore new sections of stream to collect this data. The snapshot survey would not have been possible without our partnerships with DCVA and Stroud Water Research Center. If you are interested in joining our community science program, please contact Lauren McGrath at lbm@wctrust.org. 

Filed Under: Conservation, Nature, Science, Volunteers, Watershed

Fish Shocking

November 29, 2022 By Lauren McGrath

On Saturday, October 22, the Watershed Protection Program joined scientists from the Academy of Natural Sciences of Drexel University’s Fisheries Team (ANS) to survey for fish in Ridley Creek at Ashbridge Preserve. It was a beautiful Saturday morning — crisp, bright, and perfect for learning more about the wildlife that calls Ridley Creek home! This event provided a unique opportunity to get a fish’s eye view of stream health, and it would not have been possible without the wonderful support of the talented Fisheries Team members Dr. David Keller and Paul Overbeck.

The morning started with a primer on fish survey protocols. Paul walked volunteers through the mechanics of electrofishing, a sampling technique where a small electric current is passed through the water to stun fish just long enough to be scooped up in a net and placed in a bucket. The scientists headed into Ridley Creek and began to survey, and immediately there was action in the water! 

As stunned fish began to fill the buckets, they were brought to shore and placed in aquariums to be studied. Within a short period of time, over 10 species of fish, crustaceans, and amphibians were documented. The Fisheries scientists quickly began to identify the wildlife and share what the presence of these creatures means for the ecosystem of Ridley Creek and surrounding landscape. Once the fish were observed in the aquariums, they were all safely released back into Ridley Creek. 

Included in the fishes that were identified was the American eel (Anguilla rostrata), a fish that migrates thousands of miles in its lifetime. This fish breeds in the Sargasso sea and migrates to headwater ecosystems — like at Ashbridge Preserve — where they can live over 25 years before completing their migration. The presence of this incredible fish showcases the connectivity of Ridley Creek with no large barriers to stop their movement to and from the Atlantic Ocean. American eel populations are declining due to large dams that block their migration, contribute to habitat loss, and overfishing of young eels.

Another fascinating fish present in the stream is the cutlip minnow (Exoglossum maxillingua). These fish are easy to identify up close, with a specially adapted three lobed, lower lip. These fish prefer gravel and rocky bottomed streams and are unable to thrive in polluted waterways where fine sediment buries rocky habitat. 

Black nose dace (Rhinichthys atratulus) are one of the most visibly common fishes in the headwaters of Ridley Creek and were abundant in the sample collected by ANS scientists! These fish are small, with big fish growing to be less than 4 inches long, but they school in shallow clear waters and can often be seen from the stepping stones at Ashbridge Preserve.

Fallfish (Semotilus corporalis) is the largest minnow native to eastern North America and they are abundant in the Ridley Creek headwaters! They are excellent targets for anglers, and their energetic behavior has earned them the nickname “freshwater tarpon.”

Rock Bass (Ambloplites rupestris) is well known to anglers as a sport fish, but this fish is actually an introduced species in Pennsylvania waterways! Since being introduced some time in the 1880s, they are actively stocked in waterways throughout the state.  

In addition to the fish that were sampled from Ridley Creek, ANS brought preserved specimens of fish of interest, including the northern snakehead (Channa argus), an aggressive invasive fish that has been spreading throughout the Delaware River watershed. 

This exciting and fascinating experience highlighted the importance of the ways that our activities on the landscape impacts the many lifeforms that call Ridley Creek home. The presence or absence of different species of fish can inform researchers of the health of Ridley Creek. There is a clear relationship with the development of the landscape and the decreasing health of freshwater ecosystems resulting in the loss of indicator species. As species disappear from the ecosystem, the entire system becomes weaker. As we head into a future that includes more frequent large storms, it is important that we focus on understanding how we can strengthen and improve the health of our systems to create resilience — the first step in this process is looking at who is present in the ecosystem. 

A huge thanks to the Fisheries Team for sharing their immense knowledge and skill! Click here to learn more about ongoing Fisheries research!

For more information on the research being conducted by the Watershed Protection Program and the lessons we have been learning about water quality in Ridley, Crum, and Darby Creeks, please explore the State of Our Streams Report.

— By Watershed Protection Program Director Lauren McGrath

Filed Under: Education, Science, Staff, Volunteers, Watershed

State of Our Streams Report Chapter 4: Alkalinity and Hardness

August 24, 2022 By Watershed Protection Team

By Anna Willig and Lauren McGrath | Willistown Conservation Trust Watershed Protection Program

Cover Photo by Jennifer Mathes

Since 2018, the Watershed Protection Program has monitored water quality at ten sample sites in the headwaters of Darby, Crum, and Ridley Creeks (Map 1). Every four weeks, the team visited each of the ten sites to take in-stream measurements and collect samples for analysis in the lab. We are proud to present our findings on water quality based on analysis of our data collected from 2018 through 2021, which includes 41 monitoring visits and over 7500 different measurements. 

August is National Water Quality month, and each week we will publish excerpts from one chapter from our report. Last week, Chapter 3 focused on specific conductivity, chlorides, and nutrients. If you missed the introduction to water chemistry, visit Chapter 1, or the primer on physical stream characteristics, see Chapter 2. This week, we are focusing on alkalinity and hardness. The full report, which includes more information than is provided in the blog posts, can be found here. 

Two final parameters that enhance our understanding of water quality are alkalinity and hardness. Alkalinity measures the ability of water to neutralize acidic compounds and resist changes in pH. Higher alkalinity indicates a greater ability to resist pH changes from pollutants such as wastewater effluent, protecting stream life from acidic or basic environments. Hardness is the concentration of calcium and magnesium ions in the water. Hard water has high concentrations of these ions and is generally more of a nuisance than a health concern for humans or stream life. When water is hard, it can leave behind residue on pipes, potentially leading to lower water pressure or clogging. 

Alkalinity and hardness both remain within acceptable levels for waterways in this region. Alkalinity and hardness are significantly higher in Darby Creek than in Crum and Ridley Creeks. This is most likely due to differences in regional geology, as alkalinity and hardness are primarily affected by the types of rocks and soils that water flows through. However, weathering of man-made materials, particularly concrete, can alter these parameters, and any sudden changes should be investigated. 

For a primer on statistical tests and how to read boxplots and scatterplots, click here.

Alkalinity

Figure 1. Alkalinity from January 2018 through December 2021 (a) across ten sample sites in the headwaters of the Darby, Crum, and Ridley Creeks and (b) over time.

Alkalinity, analyzed quarterly, measures the ability of a body of water to resist changes in pH; higher alkalinity denotes a greater ability to resist pH changes.1 Local geology tends to be the primary driver of alkalinity, though accelerated weathering of natural materials and weathering of man-made materials, namely concrete, increases alkalinity.2 Alkalinity remains above the Pennsylvania Department of Environmental Protection minimum of 20.0 mg/L at all sites.3 

There are significant differences in alkalinity between sites. Alkalinity is significantly higher at Darby Creek at Waterloo Mills (DCWM1) than at all other sites (Figure 1a). Alkalinity does not vary significantly with Crum Creek, but within Ridley Creek, alkalinity is significantly lower at West Branch Ridley Creek (WBRC1) than at Ridley Creek at Okehocking Preserve (RCOK1) (Figure 1a). 

Hardness

Figure 2. Hardness from January 2018 through March 2021 (a) across ten sample sites in the headwaters of the Darby, Crum, and Ridley Creeks and (b) over time.

Hardness, analyzed quarterly, is the concentration of dissolved calcium and magnesium ions in water.4 Hardness is primarily governed by the geology of a region; water dissolves calcium and magnesium as it flows through rocks and soils. Based on standards from the United States Geological Survey, water in Crum Creek is moderately hard, water in Ridley Creek ranges from moderately hard to hard, and water in Darby Creek is hard.4

There are significant differences in hardness between sites. Hardness is significantly higher at DCWM1 than at all sites besides WBRC1 (Figure 2a). Hardness varies significantly within Ridley Creek but not within Crum Creek (Figure 2a). There is little seasonal variation in hardness (Figure 2b).

Key Takeaways

  • Alkalinity is high enough at all sample sites to protect stream life from rapid changes in pH.
  • Water ranges from moderately hard to hard within the sample area. This does not pose any risk to stream life. 
  • Differences in alkalinity and hardness between sites are likely due to differences in regional geology. No actions are needed to alter alkalinity and hardness.

To read the full “State of our Streams Report,” click here.

Map 1. Willistown Conservation Trust’s sampling sites. Five sample locations are within the Ridley Creek watershed, four are within the Crum Creek Watershed, and one is within the Darby Creek Watershed. Sampling was conducted at each site every four weeks from January 2018 through December 2021.

Funding 

This report was made possible through a grant from the William Penn Foundation. The WIlliam Penn Foundation, founded in 1945 by Otto and Phoebe Haas, is dedicated to improving the quality of life in the Greater Philadelphia region through efforts that increase educational opportunities for children from low-income families, ensure a sustainable environment, foster creativity that enhances civic life, and advance philanthropy in the Philadelphia region. In 2021, the Foundation will grant more than $117 million to support vital efforts in the region. 

The opinions expressed in this report are those of the author(s) and do not necessarily reflect the views of the William Penn Foundation. 

References

1. United States Geological Survey. Alkalinity and Water. Water Science School https://www.usgs.gov/special-topic/water-science-school/science/alkalinity-and-water?qt-science_center_objects=0#qt-science_center_objects (2018).

2. Kaushal, S. S. et al. Human-accelerated weathering increases salinization, major ions, and alkalinization in fresh water across land use. Appl. Geochem. 83, 121–135 (2017).

3. Pennsylvania Department of Environmental Protection. 25 Pa. Code Chapter 93. Water Quality Standards § 93.7. Specific Water Quality Criteria. http://www.pacodeandbulletin.gov/Display/pacode?file=/secure/pacode/data/025/chapter93/chap93toc.html&d=reduce (2020).

4. United States Geological Survey. Hardness of Water. Water Science School https://www.usgs.gov/special-topic/water-science-school/science/hardness-water?qt-science_center_objects=0#qt-science_center_objects (2018).

— By Anna Willig and Lauren McGrath | Willistown Conservation Trust Watershed Protection Program

Filed Under: Education, Science, Watershed

State of Our Streams Report Chapter 3: Specific Conductivity, Chloride, and Nutrients

August 17, 2022 By CommIntern

By Anna Willig and Lauren McGrath | Willistown Conservation Trust Watershed Protection Program

Cover Photo by Jennifer Mathes

Since 2018, the Watershed Protection Program has monitored water quality at ten sample sites in the headwaters of Darby, Crum, and Ridley Creeks (Map 1). Every four weeks, the team visited each of the ten sites to take in-stream measurements and collect samples for analysis in the lab. We are proud to present our findings on water quality based on analysis of our data collected from 2018 through 2021, which includes 41 monitoring visits and over 7500 different measurements. 

August is National Water Quality month, and each week we will publish excerpts from one chapter from the report. Last week, Chapter 2 focused on discharge, turbidity, and total suspended solids. Chapter 1 gave an introduction to water chemistry. This week, we are focusing on specific conductivity, chlorides, and nutrients. The full report, which includes more information than is provided in the blog posts, can be found here. 

To better understand potential sources of pollution to the headwaters of Darby, Crum, and Ridley Creeks, we examined specific conductivity, salts, and nutrients. Specific conductivity is a broad water quality measurement that reflects the presence of ions in the water. These ions include compounds that are formed when salts and nutrients dissolve in water. Higher specific conductivity measurements indicate a higher concentration of ions. However, specific conductivity does not provide insight into the type or concentration of ions in the streams. To explain changes in specific conductivity over time or across sites, we monitored salt and nutrient concentrations. 

Chloride is an ion that forms when salts and, to a lesser extent, fertilizers dissolve in water. Elevated chloride concentrations can be toxic for stream organisms. Nutrients, mainly nitrogen and phosphorus, enter streams from fertilizer runoff and leaky septic and sewer systems, all of which increase specific conductivity. When nitrogen and phosphorus are too high, rapid algal growth can occur. This eventually leads to a depletion of dissolved oxygen. Chloride, nitrogen, and phosphorus are all naturally present in low concentrations in streams. However, changes in local land use — specifically increases in development and impervious surface cover — can increase the concentration of these compounds, threatening water quality. An impervious surface is any surface that water cannot pass through, such as buildings, roads, parking lots, and sidewalks. 

All stream samples have elevated specific conductivity (Figure 1). Elevated specific conductivity is driven by salts and nutrients, as indicated by high chloride, total nitrogen, and total phosphorus concentrations, though sites in Crum Creek are less impacted than Ridley and Darby Creek sites. While chloride and total nitrogen do not exceed levels deemed unsafe for human consumption (there are no such regulations for total phosphorus), they are still present in excess, potentially posing a threat to stream organisms. Warm water temperatures (see Chapter 1) may exacerbate the hazards posed by elevated chloride to stream life. 

Monitoring specific conductivity, chloride concentration, and nutrients reveals the importance of land protection for maintaining and improving water quality in our area. Catchments, or drainage areas, with low impervious surface cover have better water quality, as demonstrated by lower specific conductivity, chloride concentration, and nutrient concentration, than catchments with high impervious surface cover (Figure 2). The most impaired sites are Darby Creek at Waterloo Mills (DCWM1) and West Branch Ridley Creek (WBRC1), both of which have 20% impervious cover in their surrounding catchments and a high percentage of developed land. The least impaired site is West Branch Crum Creek (WBCC1), which has 9% impervious cover in its catchment, the lowest of all sites. Improving water quality, especially in Darby and Ridley Creeks, will require a reduction in excessive road salt and fertilizer use. Limiting development upstream of WBCC1 is crucial to protecting and maintaining the health of Crum Creek.

For a primer on statistical tests and how to read boxplots and scatterplots, click here.

Specific Conductivity

Figure 1. Specific conductivity from January 2018 through December 2021 (a) across ten sample sites in the headwaters of the Darby, Crum, and Ridley Creeks and (b) over time.

Specific conductivity measures how well electricity travels through water. Pure water is a poor conductor and has a low specific conductivity. Ions – often from salts (such as sodium chloride), nitrogen and phosphorus-based nutrients, and metal cations – all increase specific conductivity. As many of these ions come from anthropogenic sources, specific conductivity provides insight into the general impact of human activities on waterways. Higher specific conductivity indicates a more heavily impacted stream, but it does not indicate which compounds are entering waterways. Though there are no federal or state standards for specific conductivity, natural background levels of specific conductivity in the sampled stretches of stream are estimated to be between 75 and 95 µS/cm, which is far lower than any values measured.1 Elevated specific conductivity is expected due to the long history of human activity and development within the study area. 

There are significant differences in specific conductivity between sites. Specific conductivity is significantly lower at all Crum Creek sites than at DCWM1 and most Ridley Creek sites (Figure 1a). Interestingly, mean specific conductivity is significantly higher at WBRC1 than Main Stem Ridley Creek (RC1), despite their physical proximity (Figure 1a, Map 1). Check out this blog post to learn more about these two sites. 

Figure 2. The relationship between percent impervious surface cover and mean specific conductivity at ten sample sites in the headwaters of Darby, Crum, and Ridley Creeks from January 2018 through December 2021. Error bars represent standard error. The blue line represents a linear trendline and the shaded region shows the 95% confidence interval. 

Some spatial differences in specific conductivity between sites can be explained by the percent impervious cover in the surrounding watershed. There is a significant positive relationship between mean specific conductivity and percent impervious surface cover (Figure 2). As impervious surface cover reflects the density of human development and specific conductivity reflects human influence on streams, this relationship is unsurprising.

Specific conductivity generally remains constant throughout the year, though it can spike in winter (Figure 1b). Road salts, which are applied in the winter, form chloride when dissolved in water, increasing specific conductivity. The maximum specific conductivity at each site was recorded on days when there was notable snowmelt, indicating that runoff containing road salts is responsible for these spikes.

Chloride 

Figure 3. Monthly analysis of chloride concentration via Quantab strips from January 2019 through December 2021 (a) across ten sample sites in the headwaters of the Darby, Crum, and Ridley Creeks and (b) over time. 

Chloride is naturally present in streams at low concentrations due to the weathering of rocks and soils. Road salt is the main anthropogenic source of chloride in streams, though fertilizers can also contribute chloride. Long-term increases in chloride have been reported nation-wide.2 Chloride impacts ecosystems by altering the microbial communities that form the base of the food chain and by disrupting ion transport in aquatic plants and animals.  Though much is still unknown about the effects of chronic exposure to elevated chloride, warmer temperatures increase the toxicity of chlorides to stream insects, with consequences for the rest of the stream ecosystem.3 Click here to learn more about the impact of elevated chloride levels on streams.

Chloride concentration in the sample area has not exceeded the Pennsylvania Department of Environmental Protection potable water supply standard of 250.3 ppm, though WBRC1 and DCWM1 have reached 247 ppm (Figure 3a).4 There are significant differences in monthly chloride concentration between sites. There are no significant differences in monthly chloride concentration between Crum Creek sites (Figure 3a). However, in Ridley Creek, chloride concentration is significantly lower at Ridley Creek State Park (RCSP1) than at WBRC1, indicating either a reduction in chloride entering the stream or dilution as discharge increases (Figure 3a). Chloride concentration in Darby Creek is comparable to most Ridley Creek sites, with RCSP1 and Crum Creek sites having lower concentrations (Figure 3a). Similar to specific conductivity, chloride is significantly higher at WBRC1 than at RC1, despite their proximity (Figure 3a, Map 1). Chloride concentration is generally higher in winter months than in other seasons due to road salt applications (Figure 3b). 

Nutrients

Nutrients are a group of chemical compounds that are essential to the growth and survival of living organisms. The two most common nutrients are nitrogen and phosphorus, which enter the water through animal waste, fertilizer runoff, and leaky septic and sewer systems, and cycle through the environment in a complex system. An excess of nutrients in streams can trigger a process called eutrophication, which is the rapid growth of vegetation and algae that ultimately reduces dissolved oxygen as vegetation dies and decomposes.5

i. Total Nitrogen

Figure 4. Total nitrogen from January 2018 through March 2020 (a) across ten sample sites in the headwaters of the Darby, Crum, and Ridley Creeks and (b) over time. The dashed line represents the recommended maximum total nitrogen threshold for streams in this ecoregion. 

Total nitrogen measures the concentration of nitrates, nitrites, and ammonia in the water. Total nitrogen dynamics are mostly driven by nitrates, which are present in higher concentrations than nitrites and ammonia. The Pennsylvania Department of Environmental Protection standard for the maximum concentration of nitrates and nitrites in potable water supply is 10 mg/L.4 Total nitrogen does not approach 10 mg/L at any sample sites. 

Though total nitrogen concentration is not high enough to be dangerous for human consumption, concentrations are high enough to impair streams. Two studies of nutrient concentrations in streams in this area have found that the total nitrogen threshold for streams that are not impaired by nutrients is 2.225 – 2.3 mg/L.6-7 In the sample area, the 2.3 mg/L threshold is exceeded in 141 out of 289 samples: at least 20 times by each Ridley Creek site and at most 8 times by each Darby and Crum Creek site (Figure 4b). Furthermore, natural background concentrations of total nitrogen are estimated to be 0.10 – 0.30 mg/L for this region, which is far lower than measured concentrations at all sites (Figure 4b).8 Total nitrogen concentrations are much higher than natural background levels and regularly exceed recommended thresholds, indicating that excess nitrogen is an impairment. 

There are significant differences in total nitrogen between sites (Figure 4a). In Ridley Creek, most downstream sites have significantly lower total nitrogen than most upstream sites, which could be due to dilution with greater volumes of water (Figure 4a). Despite close physical proximity, total nitrogen is significantly higher at WBRC1 than RC1 (Figure 4a, Map 1). There are no significant differences in total nitrogen between sample sites in Crum Creek, and Crum Creek sites and DCWM1 tend to have significantly lower total nitrogen than Ridley Creek sites (Figure 4a). Total nitrogen does not vary seasonally (Figure 4b).

ii. Total Phosphorus

Figure 5. Total phosphorus concentration from January 2018 through March 2020 (a) across ten sample sites in the headwaters of the Darby, Crum, and Ridley Creeks and (b) over time. The shaded region represents estimated natural background concentrations of total phosphorus and the gray hashed line represents the recommended maximum total phosphorus threshold for streams in this ecoregion. 

Total Phosphorus is the total concentration of all phosphorus-containing compounds in streams. Natural background concentrations of total phosphorus are estimated to be 0.025 – 0.060 mg/L for this region.8 In the study area, 55 out of 289 measurements exceed the upper end of this range and 189 exceed the lower end, suggesting that phosphorus may be present in excess (Figure 5b). However, an analysis of nutrient concentrations from 2000 to 2019 in streams in Southeastern Pennsylvania found that the maximum total phosphorus concentration for a stream that is not impaired by nutrients is 0.035 mg/L.7 In the sample area, this threshold is exceeded in almost half of the samples collected (140 out of 289 samples: 24 times each by WBRC1, RCAB1, RCOK1, and RCSP1 and only up to 11 times each by all other sites), indicating that phosphorus is regularly present at high enough concentrations to impair Ridley Creek and is occasionally an impairment in Crum and Darby Creeks. 

There are significant differences in total phosphorus between sites. Total phosphorus does not vary significantly between sites in Darby and Crum Creeks (Figure 5a). In Ridley Creek, WBRC1 has significantly higher total phosphorus than RCSP1 and RC1 (Figure 5a). Though total phosphorus does not show strong seasonal variation, total phosphorus trended higher and had a broader spread from mid-2019 through 2020 than in 2018 (Figure 5b). 

Key Takeaways

  • Specific conductivity is elevated in all streams, indicating that they are impacted by human activities. 
  • Specific conductivity is related to impervious surface cover in the watershed, highlighting the importance of protecting open space and limiting development.
  • Chloride, nitrogen, and phosphorus concentrations are all elevated, contributing to specific conductivity and threatening stream health.
  • Limiting runoff of road salt by sweeping up excess after storms and reporting large piles on roads to municipalities is critical to improving stream health.
  • Reducing chemical fertilizer use or switching to using compost or other soil amendments can limit the amount of nutrients entering streams. Head over to the Farm Program to learn more about soil health.
  • Native plants act as filters for water, pulling out nutrients and other pollutants before they enter streams. Adding native plants to lawns and gardens is a great way to improve water quality while also creating habitat for wildlife.

To read the full “State of our Streams Report,” click here.

Map 1. Willistown Conservation Trust’s sampling sites. Five sample locations are within the Ridley Creek watershed, four are within the Crum Creek Watershed, and one is within the Darby Creek Watershed. Sampling was conducted at each site every four weeks from January 2018 through December 2021.

Funding 

This report was made possible through a grant from the William Penn Foundation. The WIlliam Penn Foundation, founded in 1945 by Otto and Phoebe Haas, is dedicated to improving the quality of life in the Greater Philadelphia region through efforts that increase educational opportunities for children from low-income families, ensure a sustainable environment, foster creativity that enhances civic life, and advance philanthropy in the Philadelphia region. In 2021, the Foundation will grant more than $117 million to support vital efforts in the region. 

The opinions expressed in this report are those of the author(s) and do not necessarily reflect the views of the William Penn Foundation. 

References

1. Olson, J. R. & Cormier, S. M. Modeling spatial and temporal variation in natural background specific conductivity. Environ. Sci. Technol. 53, 4316–4325 (2019).

2. Kaushal, S. S. et al. Freshwater salinization syndrome: from emerging global problem to managing risks. Biogeochemistry 154, 255–292 (2021).

3. Jackson, J. K. & Funk, D. H. Temperature affects acute mayfly responses to elevated salinity: implications for toxicity of road de-icing salts. Philos. Trans. R. Soc. B Biol. Sci. 374, 20180081 (2019).

4. Pennsylvania Department of Environmental Protection. 25 Pa. Code Chapter 93. Water Quality Standards § 93.7. Specific Water Quality Criteria. https://www.pacodeandbulletin.gov/Display/pacode?file=/secure/pacode/data/025/chapter93/chap93toc.html&d=reduce (2020).

5. United States Geological Survey. Phosphorus and Water. Water Science School https://www.usgs.gov/special-topic/water-science-school/science/phosphorus-and-water?qt-science_center_objects=0#qt-science_center_objects (2018).

6. USEPA. Ambient Water Quality Criteria Recommendations: Rivers and Streams in Ecoregion IX. 108 (2000).

7. Clune, J. W., Crawford, J. K. & Boyer, E. W. Nitrogen and Phosphorus Concentration Thresholds toward Establishing Water Quality Criteria for Pennsylvania, USA. Water 12, 3550 (2020).

8. Smith, R. A., Alexander, R. B. & Schwarz, G. E. Natural Background Concentrations of Nutrients in Streams and Rivers of the Conterminous United States. Environ. Sci. Technol. 37, 3039–3047 (2003).

By Anna Willig and Lauren McGrath | Willistown Conservation Trust Watershed Protection Program

Filed Under: Education, Science, Watershed

State of Our Streams Report Chapter 2: Physical Stream Parameters

August 10, 2022 By Watershed Protection Team

By Anna Willig and Lauren McGrath | Willistown Conservation Trust Watershed Protection Program

Cover Photo by the Watershed Protection Team

Since 2018, the Watershed Protection Program has monitored water quality at ten sample sites in the headwaters of Darby, Crum, and Ridley Creeks (Map 1). Every four weeks, the team visited each of the ten sites to take in-stream measurements and collect samples for analysis in the lab. We are proud to present our findings on water quality based on analysis of our data collected from 2018 through 2021, which includes 41 monitoring visits and over 7500 different measurements. 

August is National Water Quality month, and each week we will publish excerpts from one chapter from our report. Last week, Chapter 1 we focused on the basic water chemistry parameters of water temperature, dissolved oxygen, and pH. This week, we are focusing on the physical characteristics of the stream: discharge, turbidity, and total suspended solids.

The full report, which includes more information than is provided in the blog posts, can be found here.

_____________________________________________

Monitoring the physical characteristics of streams, in addition to water chemistry, provides deeper insight into water quality and stream health. Discharge is the volume of water flowing through the stream, turbidity is the cloudiness of water, and total suspended solids is a measurement of the total mass of sediment and debris in the water. 

These parameters are influenced by the landscape in the surrounding watershed. Impervious surfaces, or surfaces that block the infiltration of water into the soil, can increase the velocity and energy of water during storm events, allowing stormwater to pick up and carry more sediment into the nearest body of water. By preventing infiltration, impervious surfaces also force more water into streams during storm events, resulting in greater flooding and erosion. The removal of trees and shrubs along waterways destabilizes soil, leading to more sediment in streams. Headwater streams, which are the origins of stream systems, can carry tons of sediment and pollution into the stream throughout the entire waterway, harming downstream ecosystems. Studying discharge and sediment dynamics can help identify areas of rapid erosion that should be targeted for restoration.

The headwaters of Darby, Crum, and Ridley Creeks are highly responsive to rainfall events, as indicated by spikes in discharge after storm events. There is constant, though often low, movement of sediment through the sample sites, as indicated by turbidity and total suspended solids. Sediment movement increases after rainfall or snowmelt events. Though there are no regulations governing acceptable amounts of sediment in streams, it is possible that sediment poses a risk to stream life during storm events. Analysis of sediment movement and erosion dynamics is ongoing to identify areas where restoration should target soil stabilization.

For a primer on statistical tests and how to read boxplots and scatterplots, click here.

Discharge

Figure 1. Stream discharge from January 2018 through December 2021 (a) across ten sample sites in the headwaters of the Darby, Crum, and Ridley Creeks and (b) over time.

Discharge is the volume of water flowing through a stream and is measured in cubic meters per second (m3/s). Discharge reflects the size of the stream; as more tributaries enter the stream and it gets bigger, discharge increases as well. Prior to June 5, 2019, discharge was not consistently measured on sample days.

There are significant differences in discharge between sites. Within each watershed, discharge is significantly higher at the most downstream site than it is at the most upstream sites, as expected, and discharge at Ridley Creek State Park (RCSP1) is significantly greater than discharge at all other sample sites (Figure 1a). 

Spikes in discharge are related to rainfall or snowmelt events, which increase the amount of water flowing through the stream. Changes can also be caused by debris in the stream channel. For example, the abrupt increase in discharge at RCSP1 on September 25, 2019 was likely caused by a downed tree that dammed Ridley Creek just downstream of the sample site (Figure 1b). By January 8, 2020, the tree was cleared and discharge returned to normal (Figure 1b). Decreases in discharge during summer months are generally caused by lack of rainfall. The lowest discharge at all sites but Crum Creek Main Stem Downstream (CC3) was recorded on August 16, 2021, after an extended period with little rain (Figure 1b).

Turbidity

Figure 2. Turbidity from January 2018 through December 2021 (a) across ten sample sites in the headwaters of the Darby, Crum, and Ridley Creeks and (b) over time. 

Turbidity measures the amount of light that can pass through a water sample. Clear water has low turbidity and cloudy water has high turbidity. Turbidity provides an estimate for the amount of sand, silt, and other sediment in the water; as the amount of sediment in the water increases, so does the turbidity. However, turbidity is sensitive to the type of sediment — differences in the size, texture, and shape of sediment particles impact turbidity measurements — and should be considered a gross approximation for sediment concentration.

There are no significant differences in turbidity between sites (Figure 2a). Turbidity does not vary seasonally (Figure 2b). There is a significant but weak correlation between turbidity and discharge, suggesting that spikes in turbidity are related to influxes of sediment after rainfall or snowmelt events. The weakness of the relationship is likely due to differences in the amount of erosion and the type of sediment at each sample site.

Total Suspended Solids

Figure 3. Total suspended solids from January 2018 through December 2021 (a) across ten sample sites in the headwaters of the Darby, Crum, and Ridley Creeks and (b) over time. (c) The relationship between turbidity and total suspended solids.The blue line is the linear trendline and the shaded region represents the 95% confidence interval.

Closely related to turbidity is total suspended solids, or the mass of suspended particles, usually sediment, in a specified volume of water. While turbidity roughly estimates the amount of sediment in the water, total suspended solids is a more exact approximation. Though the transport of sediment is a natural process in streams and rivers, excess or sudden movement of sediment can harm aquatic organisms. When sediment is deposited on stream beds, it can smother macroinvertebrates and cover crucial streambed habitat. In the water column, suspended solids absorb sunlight, heating up the water and limiting the ability of aquatic plants and algae to photosynthesize. Though total suspended solids analysis helps understand erosion and sediment movement in waterways, there are no state or federal standards governing acceptable concentrations of total suspended solids.

There are no significant differences in total suspended solids between sites (Figure 3a). total suspended solids does not show strong seasonal variation; spikes in total suspended solids are likely due to influxes of sediment after precipitation events (Figure 3b). There is a significant, but weak, correlation between discharge and total suspended solids. There is a significant correlation between turbidity and total suspended solids, indicating that turbidity can reflect total suspended solids (Figure 3c). However, due to differences in sediment characteristics, turbidity should only be used to predict total suspended solids at a site-specific scale.

Future analysis includes developing a rating curve to estimate the amount of sediment moving through a stream, which will help identify areas of rapid erosion that should be targeted for restoration.

Key Takeaways

  • Discharge generally remains constant, but is responsive to rainfall events. 
  • There is constant, though often low, movement of sediment through our streams.
  • Storm events can wash large quantities of sediment into streams, potentially posing a risk to aquatic organisms. 
  • To learn more about discharge, erosion, and flooding, check out Flooding 101 and Flooding 102. 

To read the full “State of our Streams Report,” click here.

Map 1. Willistown Conservation Trust’s sampling sites. Five sample locations are within the Ridley Creek watershed, four are within the Crum Creek Watershed, and one is within the Darby Creek Watershed. Sampling was conducted at each site every four weeks from January 2018 through December 2021.

Funding 

This report was made possible through a grant from the William Penn Foundation. The WIlliam Penn Foundation, founded in 1945 by Otto and Phoebe Haas, is dedicated to improving the quality of life in the Greater Philadelphia region through efforts that increase educational opportunities for children from low-income families, ensure a sustainable environment, foster creativity that enhances civic life, and advance philanthropy in the Philadelphia region. In 2021, the Foundation will grant more than $117 million to support vital efforts in the region. 

The opinions expressed in this report are those of the author(s) and do not necessarily reflect the views of the William Penn Foundation. 

— By Anna Willig and Lauren McGrath | Willistown Conservation Trust Watershed Protection Program

Filed Under: Science, Watershed

  • 1
  • 2
  • 3
  • …
  • 5
  • Next Page »

OUR NATURE PRESERVES

Our nature preserves are open to the public 365 days per year from sunrise to sunset, providing natural places that offer peace and respite for all. Willistown Conservation Trust owns and manages three nature preserves in the Willistown area - Ashbridge, Kirkwood and Rushton Woods Preserve. We maintain these lands for the … Learn more about our nature preserves.

Upcoming Events

30 March

Stewardship Volunteer Thursday

View Detail
01 April

Watershed Volunteer Day

View Detail
05 April
Rushton Conservation Center

Workshop: Spring Mindful Birding at Dusk

915 Delchester Road, Newtown Square, PA

View Detail
No event found!
Load More

DONATE TODAY!

Invest in Nature! ENGAGE CONNECT SPONSOR LEAVE A LEGACY   If you would like to make a gift of securities, such as stocks, bonds, or mutual fund shares, please contact us at 610-353-2562 for instructions. For more … Donate Today

CONTACT

925 Providence Road
Newtown Square, PA 19073
(610) 353-2562
land@wctrust.org

WHERE WE WORK

The work of the Willistown Conservation Trust is concentrated on 28,000 acres of Willistown Township … read more

JOIN OUR MAILING LIST

FAQs

Copyright © 2023 · WCTRUST.ORG