By Watershed Protection Program Co-op Sarah Barker
Biofilms are all around us! Often thought of as pests in any environment humans find them, these overlooked communities are wonderous mini ecosystems that power some of our most treasured natural habitats. “Biofilm” is a catch-all term used to describe communities of primarily fungi, bacteria, micro and macro algae, viruses, and an ancient group of single-celled organisms called archaea that, together, can thrive in extreme environments, living in a kind of micro-city. Depending on where they are found, the numbers and types of different little creatures living within a given biofilm can change wildly.
Most of the organisms that live in biofilms are very specific about what conditions they need to survive and thrive. Factors like temperature, light availability, and moisture or humidity can completely change what kinds of algae, fungi, bacteria, archaea, viruses, and other organisms decide to join that community.
Biofilms can be found in any number of places from desert sand to the backs of your teeth! However, your dentists don’t love biofilms, because they can accumulate cavity-causing bacteria if you don’t brush your teeth often enough. Biofilms can also be destructive to man-made objects and buildings. When it comes to water pipes, any submerged concrete, or regular stone buildings, biofilms can worsen natural weathering, create cracks, or even destroy the entire structure given enough time.
However, biofilms are also, surprisingly enough, quite useful in some industrial, agricultural, and sanitary operations like breaking up toxins from chemical spills and promoting root growth in crops. They can also be used in facilities to treat wastewater for certain kinds of toxins. Studies show that freshwater biofilms serve as an essential “sink” for some toxic trace metals like arsenic. What this means is that they can take up these metals, store them, and over time, turn them into other molecules that can be used by the ecosystem safely!
The main difference between the two functional extremes of nuisance and foundation of the food web is the unique mixture of methods an individual biofilm will use to produce and use energy.
There are two main ways that biofilms can generate or consume energy: through oxygen-driven processes like photosynthesis, or chemical reactions which happen in areas lacking oxygen. These chemical reactions, mostly caused by bacteria or archaea, are essential sources of nutrients including nitrogen for freshwater ecosystems.
Almost every biofilm will have a combination of these processes happening at the same time. Bacteria and archaea will generate chemical reactions that produce molecules needed by another member of the biofilm like diatoms (microscopic single-celled algae) in order to start photosynthesis. Therefore, each individual part of the biofilm contributes to a vast network of chemical reactions and energy exchanges that can enrich or maintain an entire ecosystem.
Biofilms can play any number of roles in a habitat. In desert ecosystems, biofilms act as anchors, using their sticky materials to bind sand grains together, which allows plants to start growing without being ripped from their positions by the strong winds. In rivers and streams, biofilms are major producers of energy for the whole food chain, and out in the ocean, biofilms are responsible for taking a great deal of nutrients and oxygen from the air and making them available in the water for other creatures to use.
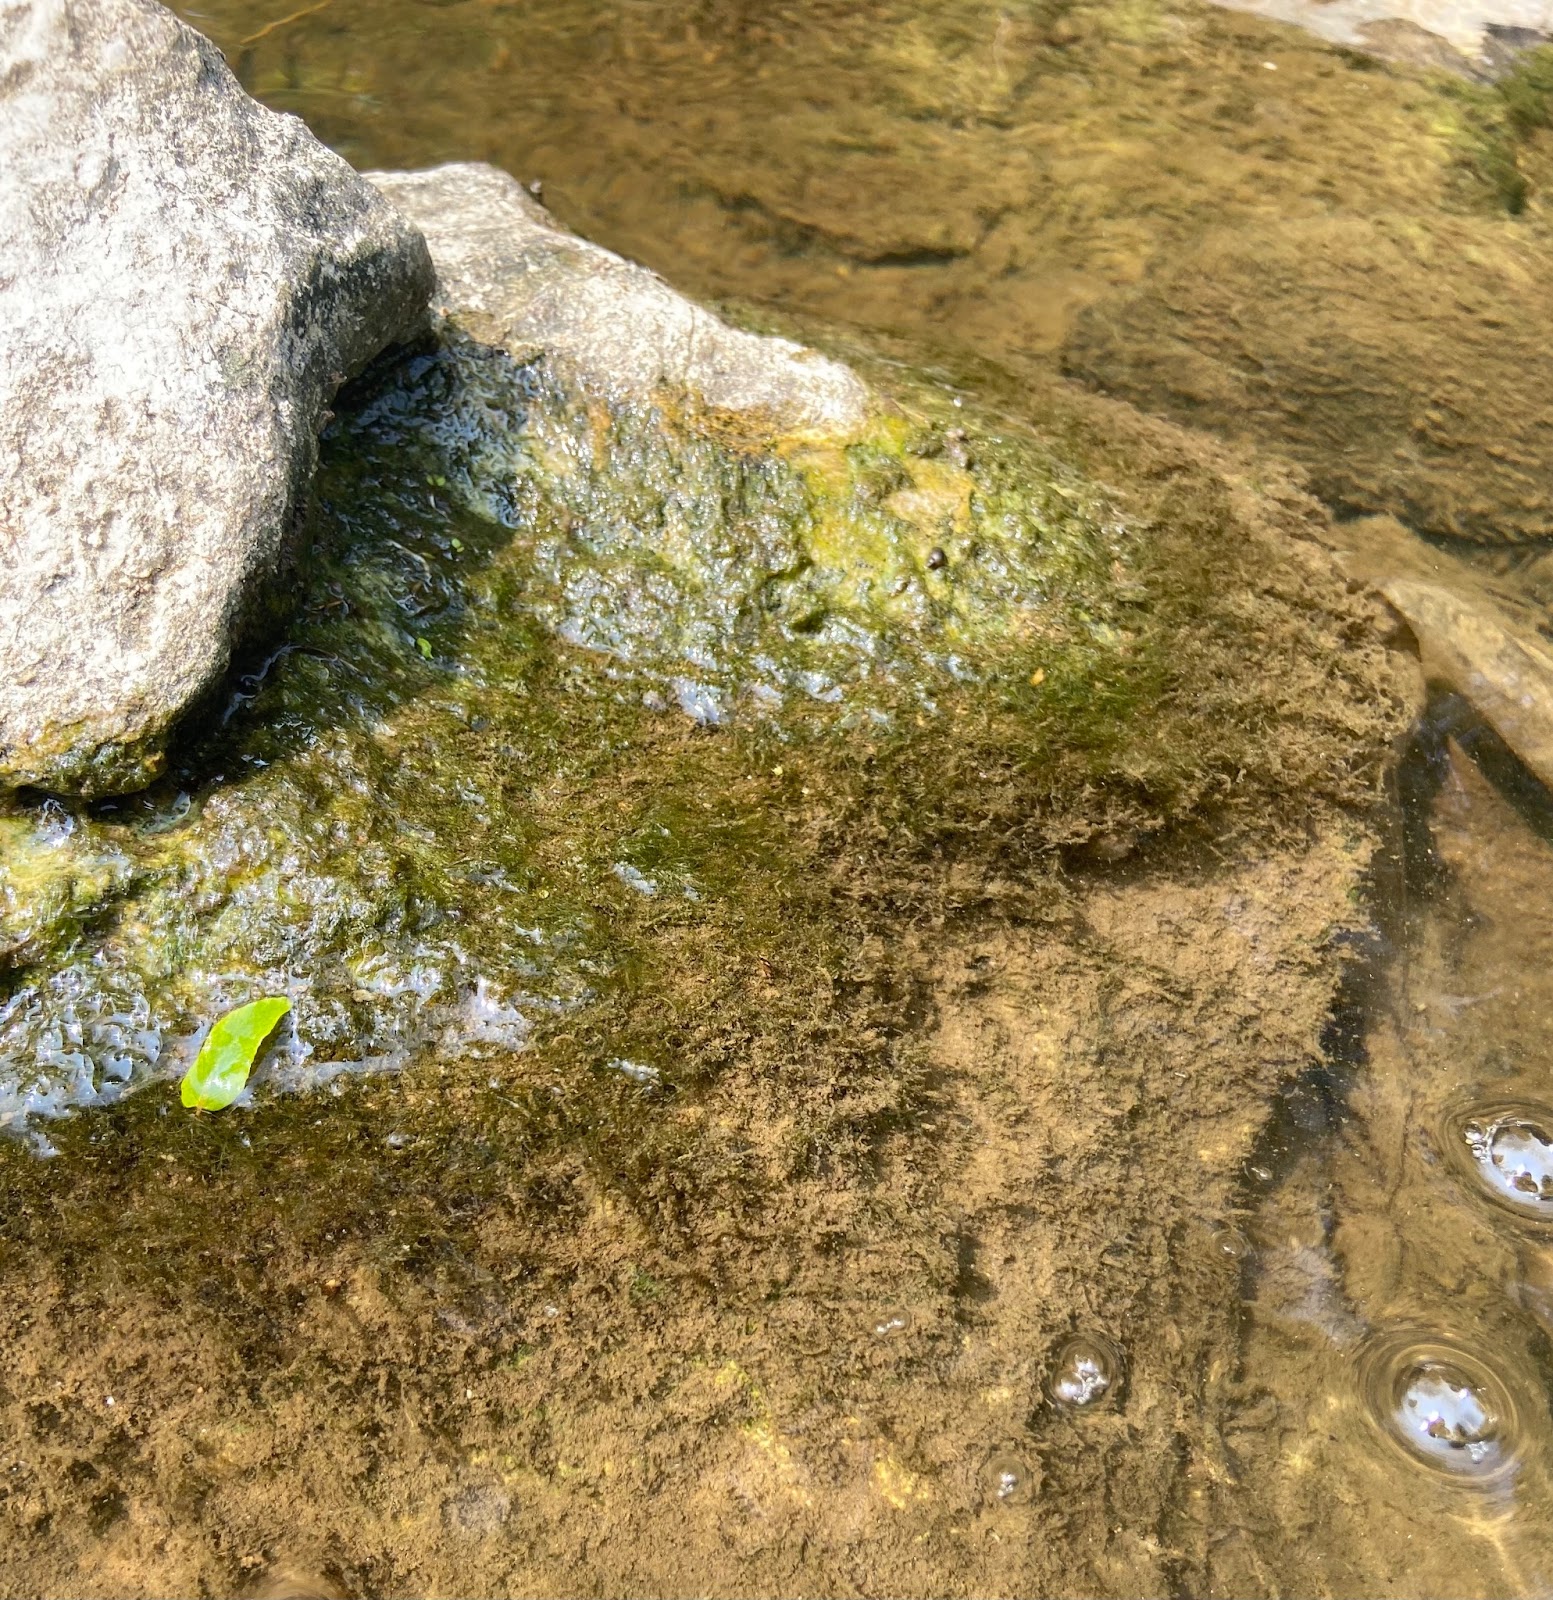
However, maybe most impressively, biofilms are the main producers of energy for areas that feature many ice sheets, like polar ice valleys and ice-covered lakes. Biofilms truly are fascinating forces of nature capable of sustaining an entire ecosystem, destroying structures, cleaning our water, fertilizing crops, and even causing cavities. So the next time you see a slimy film on a rock, thank your little biofilm friends for all their hard work!
References:
Barral-Fraga, L., Martiñá-Prieto, D., Barral, M. T., Morin, S., & Guasch, H. (2018). Mutual interaction between arsenic and biofilm in a mining impacted river. Science of The Total Environment, 636, 985–998. https://doi.org/10.1016/j.scitotenv.2018.04.287
Bharti, A., Velmourougane, K., & Prasanna, R. (2017). Phototrophic biofilms: Diversity, ecology and applications. Journal of Applied Phycology, 29(6), 2729–2744. https://doi.org/10.1007/s10811-017-1172-9
Romani, R. M., Guasch, H., Balaguer, M. D., & de Montilivi, C. (2016). Aquatic biofilms: Ecology, water quality and wastewater treatment (1st ed.). Caister Academic Press.
Zijnge, V., van Leeuwen, M. B., Degener, J. E., Abbas, F., Thurnheer, T., Gmür, R., & M. Harmsen, H. J. (2010). Oral biofilm architecture on natural teeth. PLoS ONE, 5(2). https://doi.org/10.1371/journal.pone.0009321