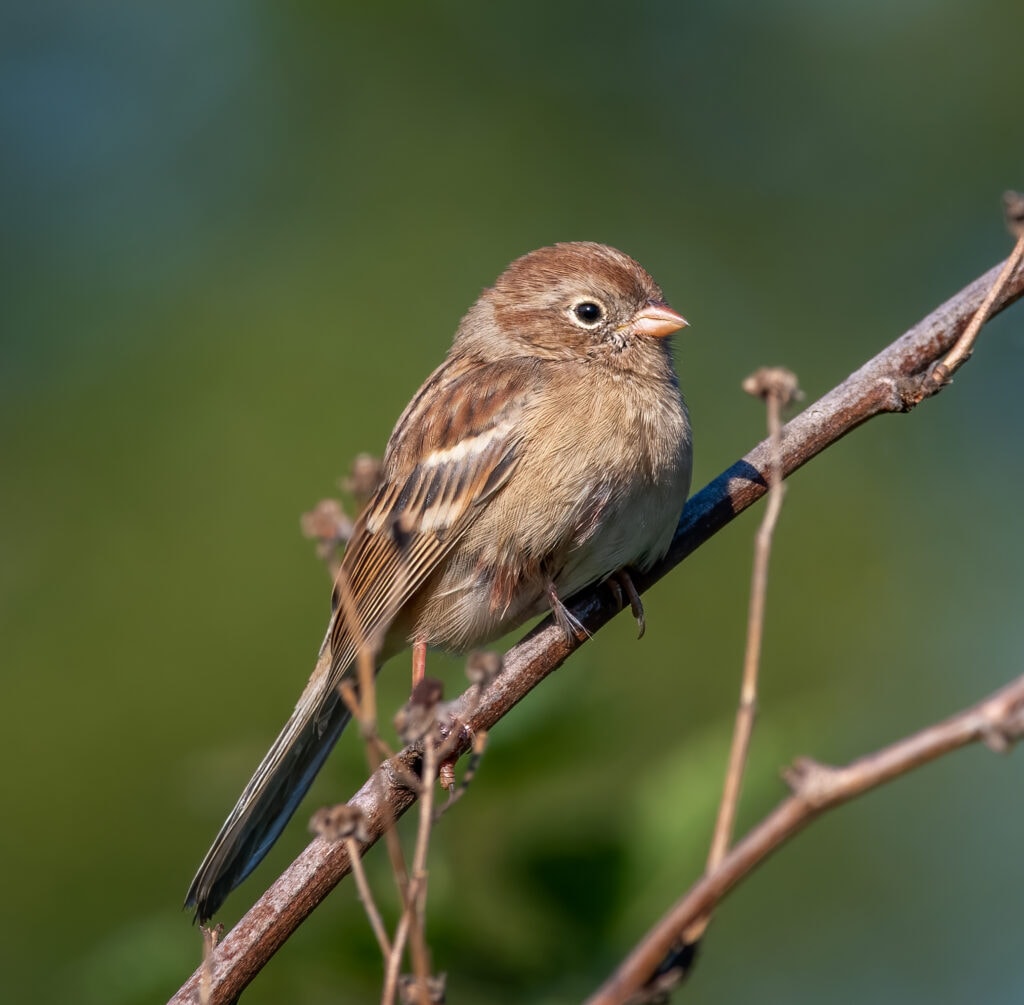
The land trusts will promote land management practices that benefit the Bobolink, Eastern Meadowlark, and Grasshopper Sparrow
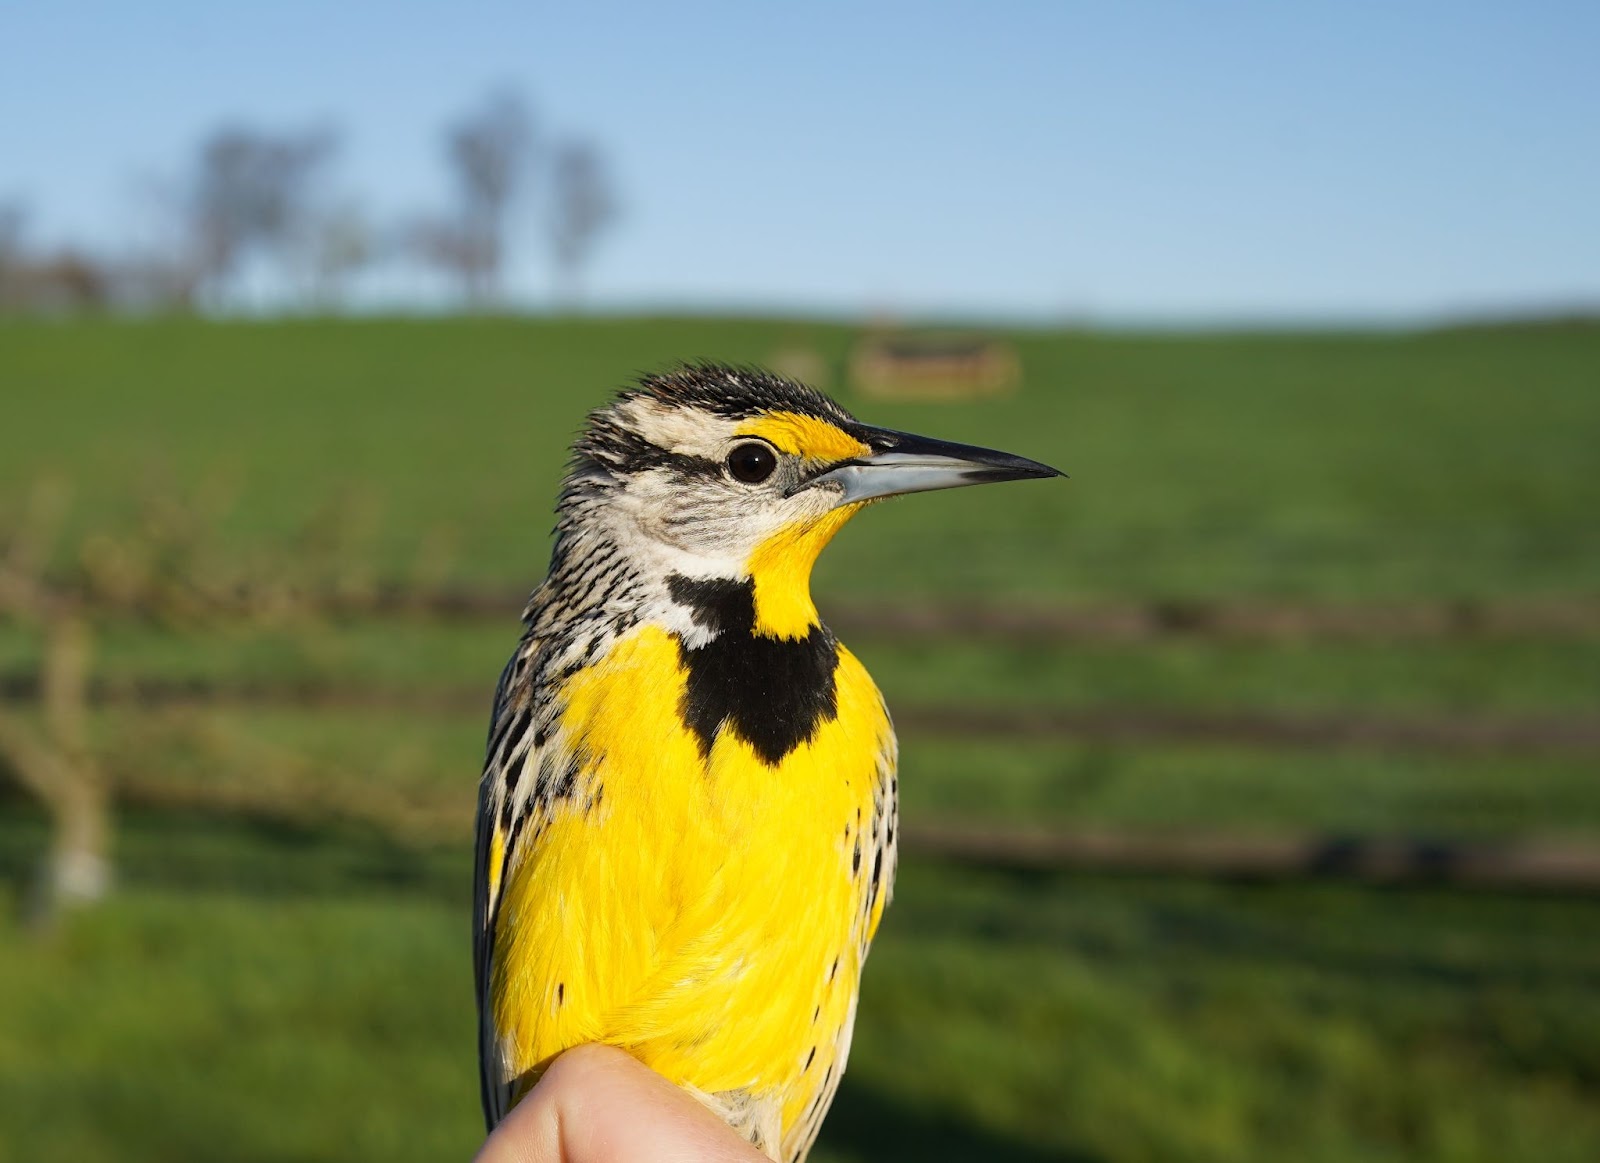
Eastern Meadowlark captured and released by WCT staff on a local farm. Photo by Aaron Coolman
The Cornell Land Trust Bird Conservation Initiative has awarded Willistown Conservation Trust (WCT) and Natural Lands a $25,000 grant to promote grassland conservation in the greater Doe Run area of Chester County. The Cornell Land Trust grant will support the Grassland Bird Collaboration (GBC) — launched by WCT in 2022 — and their goal to create a grassland bird conservation area made up of working landscapes and existing preserves in southern Chester County. This “working conservation landscape” will benefit grassland bird species that have been in decline due to changes in farming practices and increased land development. The GBC will create a focal area where partners can work together to address these issues affecting grassland birds, while maximizing conservation and minimizing disruption to agricultural production.
The GBC works with landowners and farmers to conserve and augment grassland bird populations through conservation land management practices, research, education, and community engagement. With this grant, WCT will lead the initiative by working on private lands educating landowners on best land management practices to conserve three focal grassland bird species — Bobolink, Eastern Meadowlark, and Grasshopper Sparrow — while Natural Lands uses its network of publicly accessible nature preserves to manage land for these grassland birds.
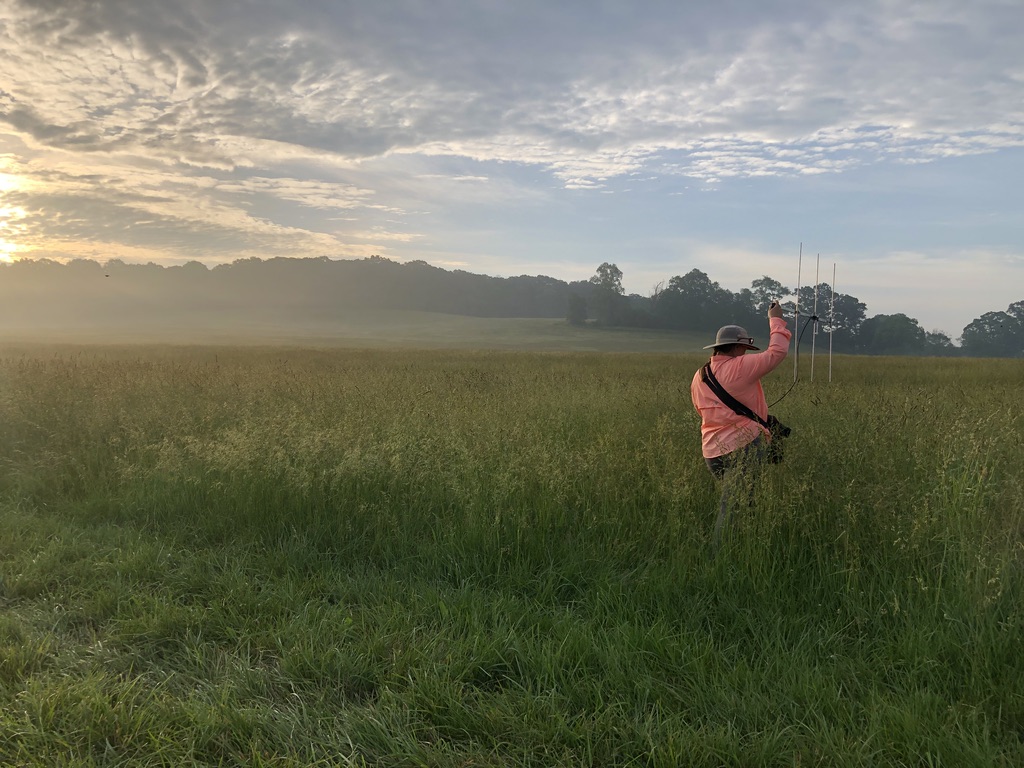
WCT staff prepare to track grassland birds. Photo by Willistown Conservation Trust
One of the most vital land management practices is delaying mowing during the breeding period. Mowing before birds complete their nesting cycle removes available habitat. Implementing a “no-mow” period when there are babies and fledglings in a field allows young birds to develop in a safe environment before the nesting grounds are disturbed.
So far, the GBC has partnered with landowners and farmers to enroll more than 750 acres of privately held land in “bird-sensitive” field management practices to accommodate the focal species’ annual breeding cycle. This enthusiasm is largely thanks to WCT having built relationships with these landowners and farmers since 2014. Additionally, Natural Lands will employ best management practices, monitor their nature preserves — including Stroud Preserve, Cheslen Preserve, and Bryn Coed Preserve — during breeding season, and promote these practices through demonstration areas and outreach efforts.
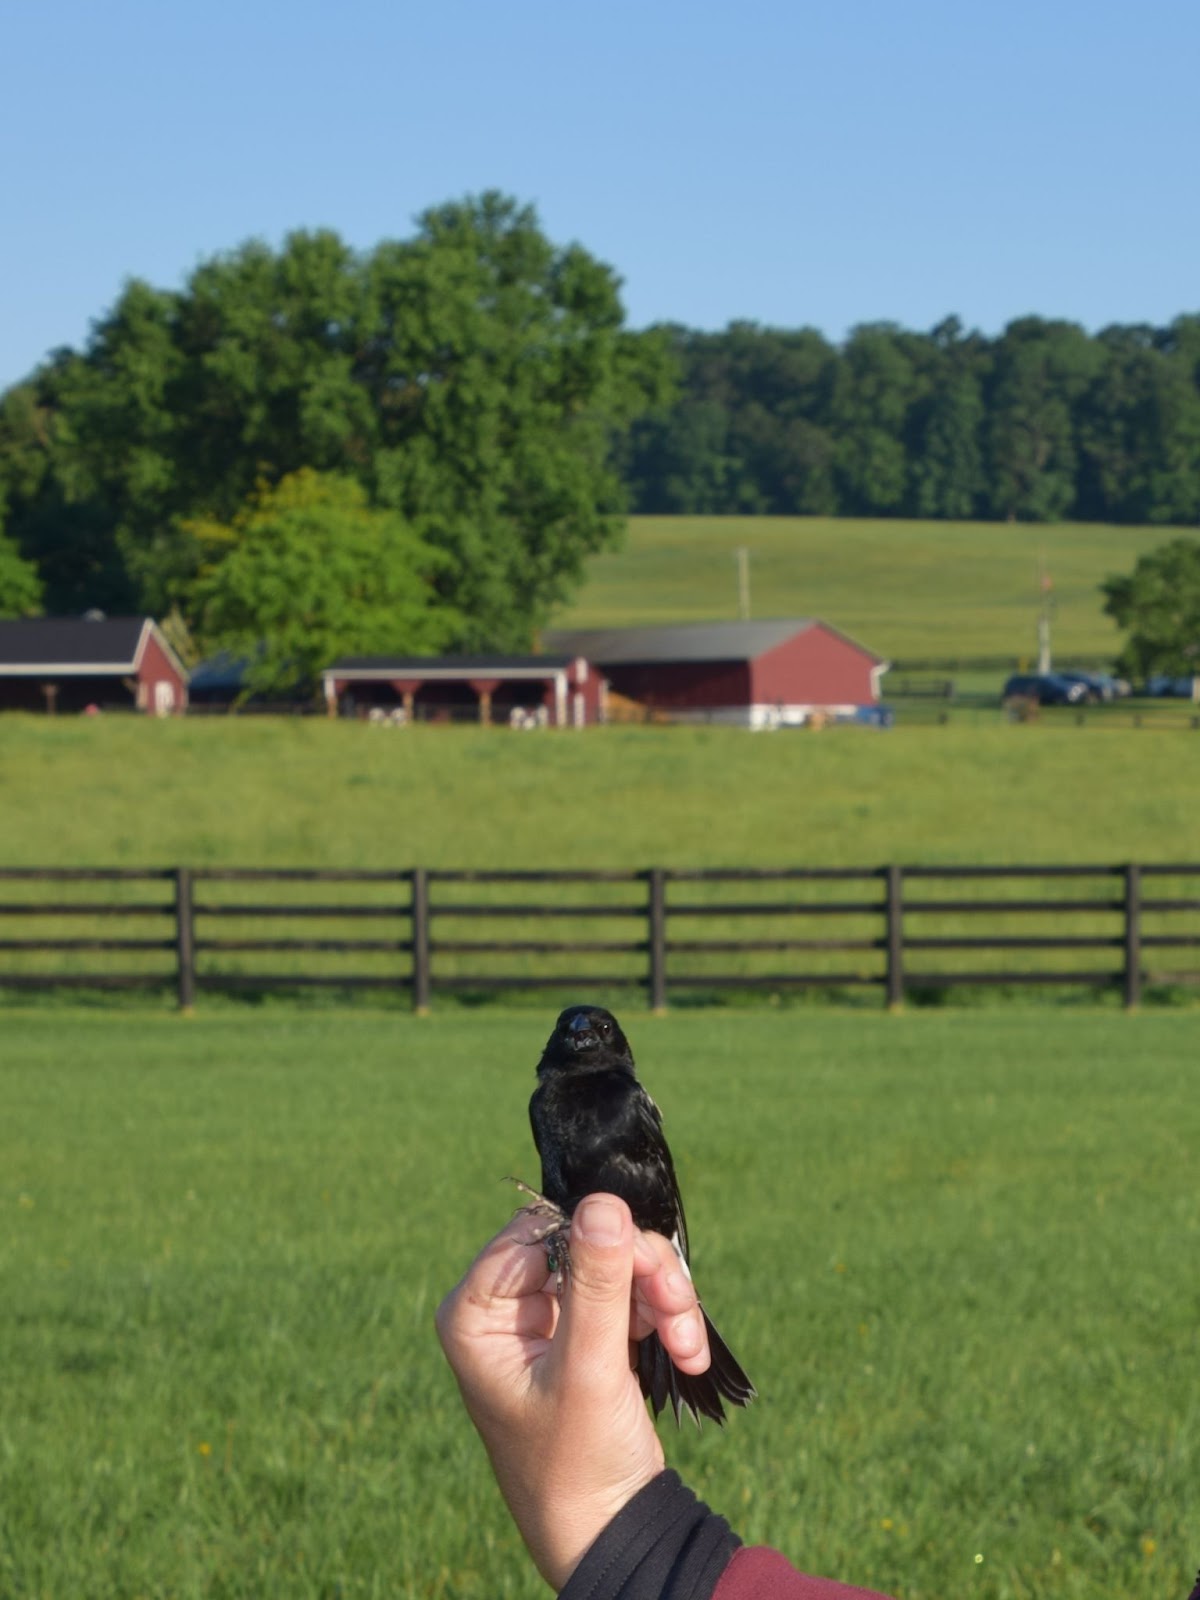
A Bobolink captured and released by WCT staff at a Chester County property. Photo by Amanda Dunbar
The project will also include a research component using the Motus Wildlife Tracking System to gain insights into how Bobolinks use the working landscape of Chester County. Since 2021, WCT has been using nanotags to track Bobolink movement among fields during breeding and through migration. This collection of data provides a greater understanding of habitat use and connectivity.
“When we share Motus data that show the birds’ use of local fields and the benefit of delayed mowing, landowners understand the importance of their fields for grassland bird conservation,” says Lisa Kiziuk, Willistown Conservation Trust’s director of bird conservation program. “The Motus data have become a tool for understanding the birds’ needs and a tool for public engagement.”
Chester County is well positioned to support this conservation effort largely thanks to local mushroom farms’ demand for mulch hay. Mushroom houses prefer later-season hay that has been left to mature and dry in the fields. Providing for the mushroom market means there is less disruption to farming practices and to the grassland birds during their crucial breeding period. “The unique local agricultural market provides a great opportunity to work with farmers to meet our conservation goals,” says Zoë Warner, project manager for the Grassland Bird Collaboration. “This enables us to increase the value of conserved land within a large contiguous preservation belt. The land will not simply be ‘open space.’ It will provide valuable and essential breeding grounds to help reverse the precipitous decline of grassland birds.”
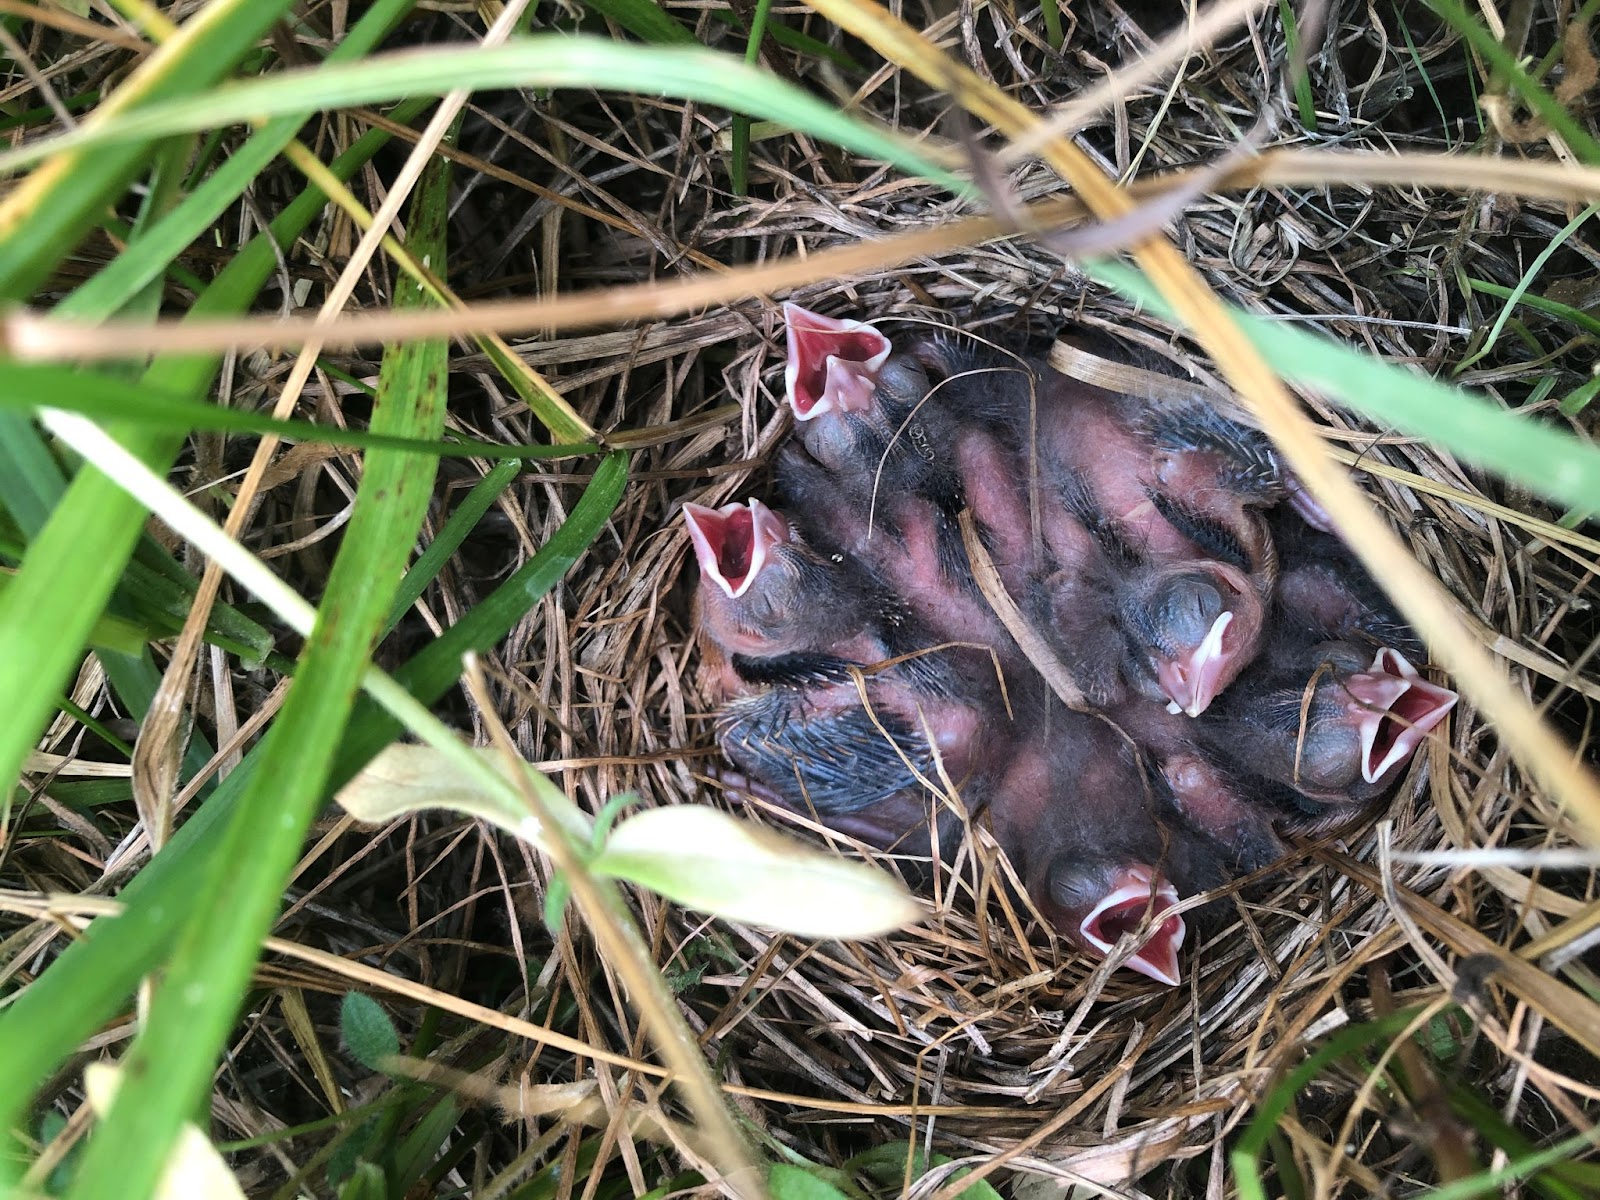
Baby Bobolinks in a nest that has been protected thanks to no-mow practices. Photo by Amanda Dunbar
“Our shared vision is to create a grassland bird conservation area made up of working landscapes and existing nature preserves in southern Chester County,” says Gary Gimbert, Natural Lands’ vice president of stewardship. “Natural Lands’ nature preserves in Chester County alone total more than 4,000 acres. We are excited to use our properties to help establish a focal conservation area that protects grassland bird species during the breeding cycle.”
“The Grassland Bird Collaboration complements the work Stroud Water Research Center has undertaken to improve stream quality throughout the greater Doe Run area,” says David Arscott, Ph.D., executive director and research scientist at Stroud Water Research Center. “Improving meadow and hay/pasture management to enhance grassland bird habitat is synergistic with our activities, and we are supportive of working together with landowners, WCT, and Natural Lands to implement these practices.”
WCT Media Contact: Monica McQuail, mjm@wctrust.org
Natural Lands Media Contact: Kirsten Werner, kwerner@natlands.org