WILLISTOWN CONSERVATION TRUST

  • Facebook
  • Instagram
  • LinkedIn
  • YouTube
DONATE
  • About
    • HOW WE WORK
    • WHERE WE WORK
    • OUR STAFF AND TRUSTEES
    • JOBS & INTERNSHIPS
    • VOLUNTEER
    • RUSHTON CONSERVATION CENTER
    • STRATEGIC PLAN
    • DIVERSITY, EQUITY & INCLUSION STATEMENT
    • FAQs
  • LATEST
    • BLOG
    • IN THE NEWS
    • PUBLICATIONS
    • PHOTOS
  • PROGRAMS
    • BIRD CONSERVATION
    • COMMUNITY FARM
    • EDUCATION
    • LAND PROTECTION
    • STEWARDSHIP
    • WATERSHED PROTECTION
  • NATURE PRESERVES
    • ASHBRIDGE PRESERVE
    • HARTMAN MEADOW
    • KESTREL HILL PRESERVE
    • KIRKWOOD PRESERVE
    • RUSHTON WOODS PRESERVE
  • EVENTS
    • EVENT CALENDAR
    • BARNS & BBQ
    • RUN-A-MUCK
    • WILDFLOWER WEEK
    • ECOCENTRIC EXPERIENCE
    • RUSHTON NATURE KEEPERS (RNK)
    • ACCESS Program
  • Support
    • WAYS TO GIVE
    • SPONSOR THE TRUST
    • CORPORATE PARTNERSHIP PROGRAM
    • JOIN THE SYCAMORE SOCIETY
    • LEGACY SOCIETY & PLANNED GIVING
    • DELCO Gives 2025
  • CAMPAIGN FOR KESTREL HILL PRESERVE

Project Plastic and the Hunt for Microplastics

July 27, 2022 By Watershed Protection Team

By Amy Amatya of Project Plastic

Some of the greatest challenges humanity faces today — pandemics, climate change, water contamination — are invisible. They escalate because we don’t see them coming, or we ignore the data that help us see them. 

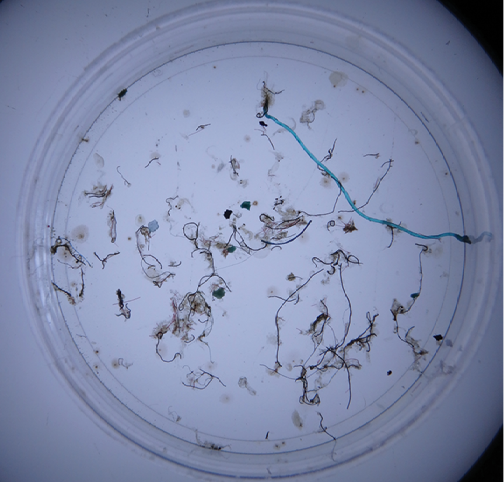
Microplastics are no exception. Defined as any plastic smaller than five millimeters in diameter, microplastics pose a big problem to the environment and ourselves. They are easily ingested, potentially toxic, and everywhere. In fact, microplastics are found in nearly every corner of the world, right down to the tissues of living organisms. 

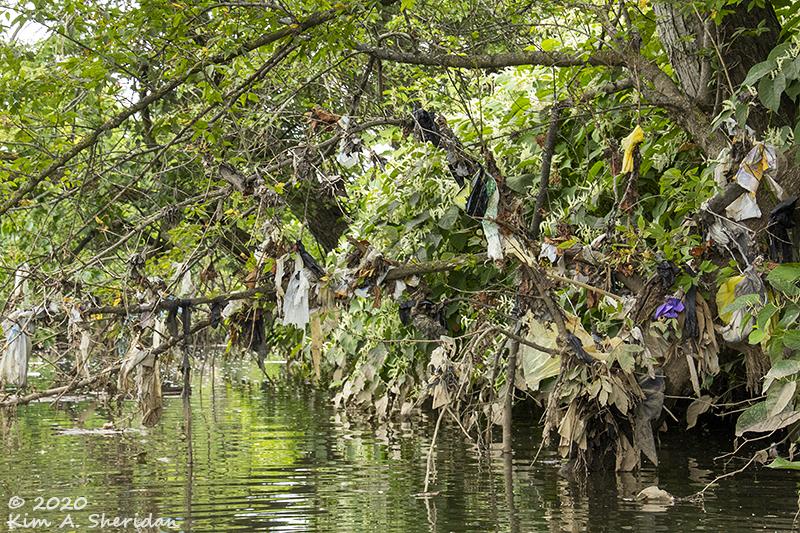
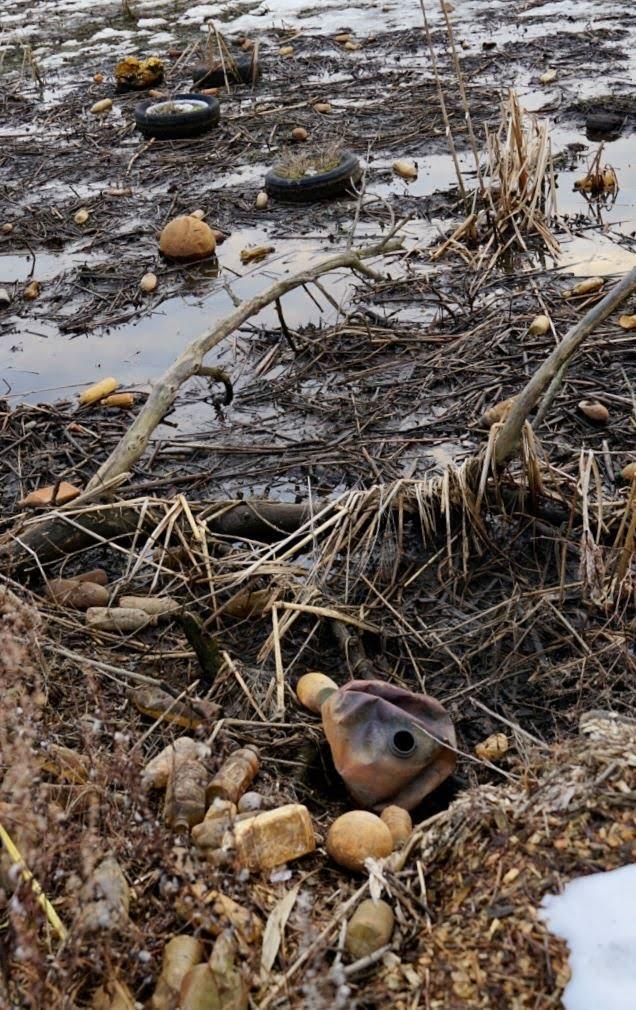
Microplastics exist via two pathways: they are mass-produced to be this size (‘primary’), or they come from the degradation of larger plastics (‘secondary’). Primary microplastics are difficult to target because production is controlled by industries including textiles, cosmetics, and household items. Considerable persuasion of regulators and corporations is necessary to reduce microplastic production. Some progress has been made on this front, as the Microbead-Free Waters Act of 2015 prohibits microplastic use in wash-off cosmetics. However, secondary microplastics are difficult to target because a lot of plastic already exists in the world. The sheer difference in scale between microplastics and the landscapes they inhabit prohibit remediation. Even if we ceased all plastic production today, there are still 200 million tons of plastic circulating in our oceans.

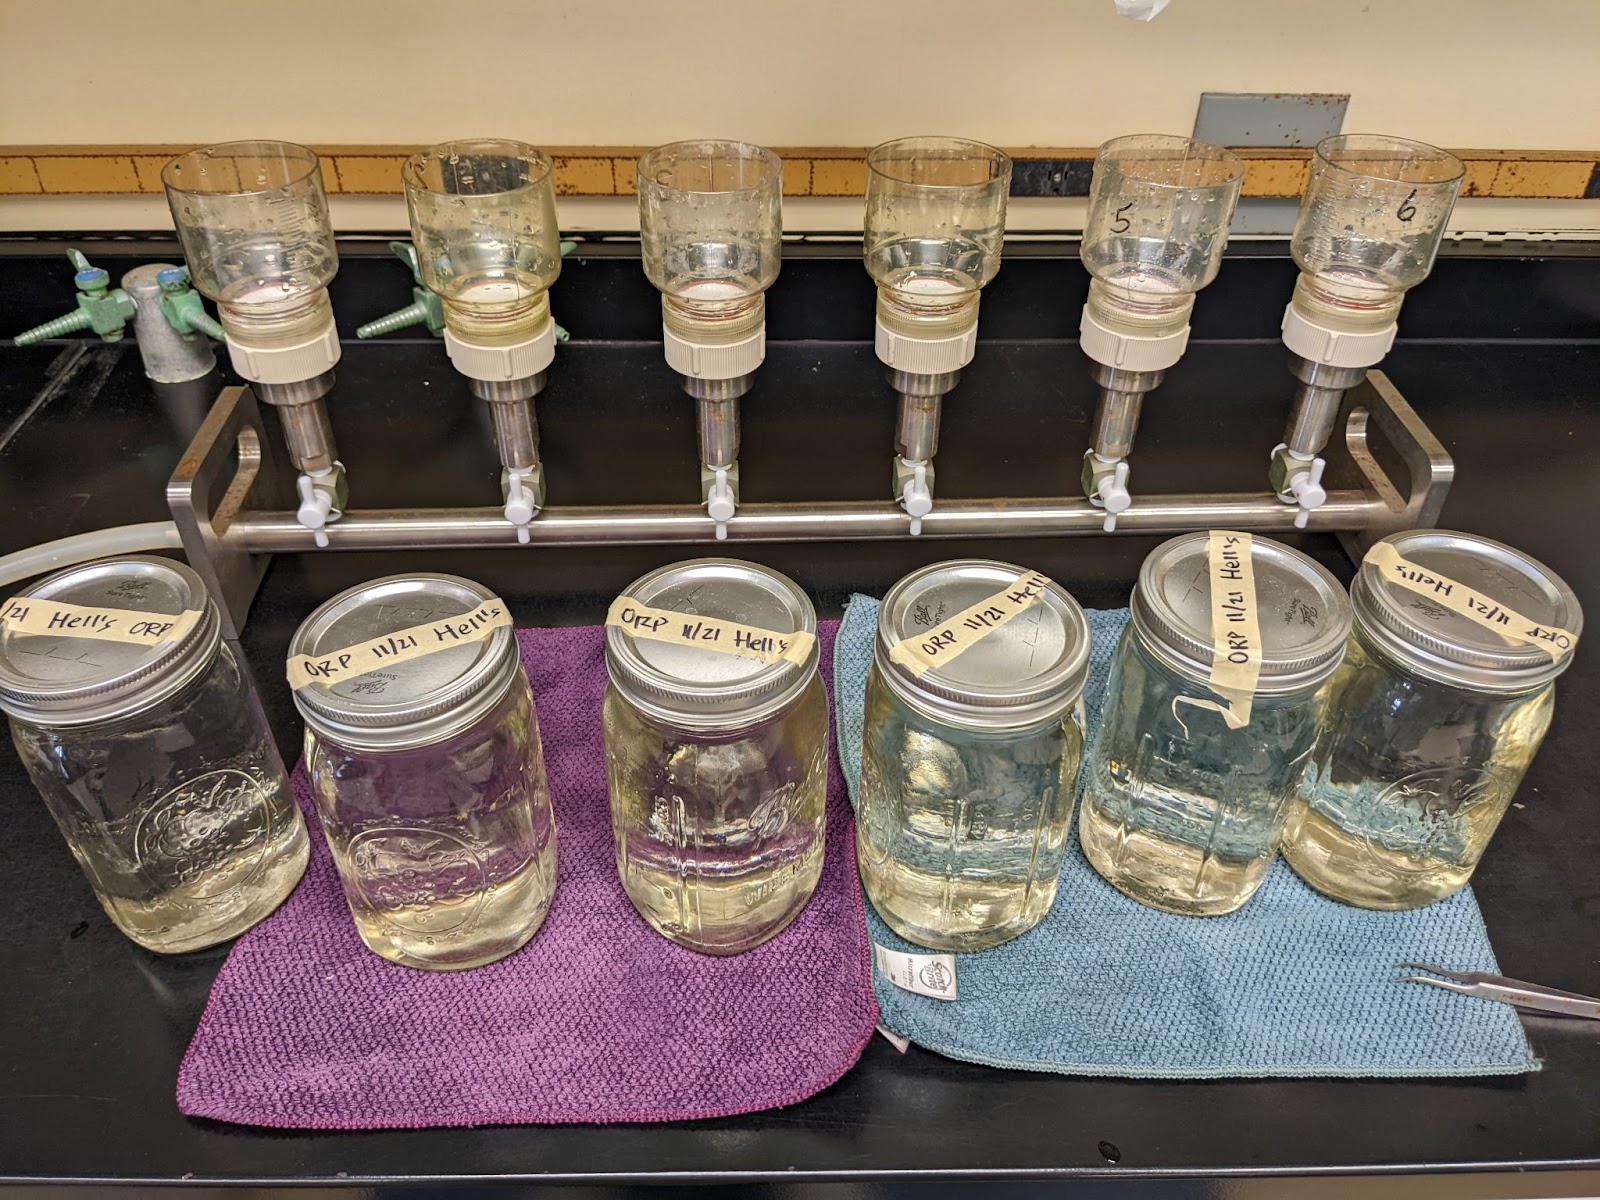
Despite their huge threat, there are no consistent protocols available for the accurate and 

systematic recording of microplastic pollutant concentrations in water. There is also no existing technology available to sequester all microplastics from tributaries, effluent streams, reservoirs and lakes. There are three approaches to reducing microplastic pollution. We can: 

1) Produce less plastic, 

2) Prevent existing plastic from entering the environment, and 

3) Remove microplastics directly from the environment. 

The Project Plastic meets with the ACUA Wastewater Treatment Facility about the future of Plastic Hunters in wastewater management systems. Photo by Project Plastic

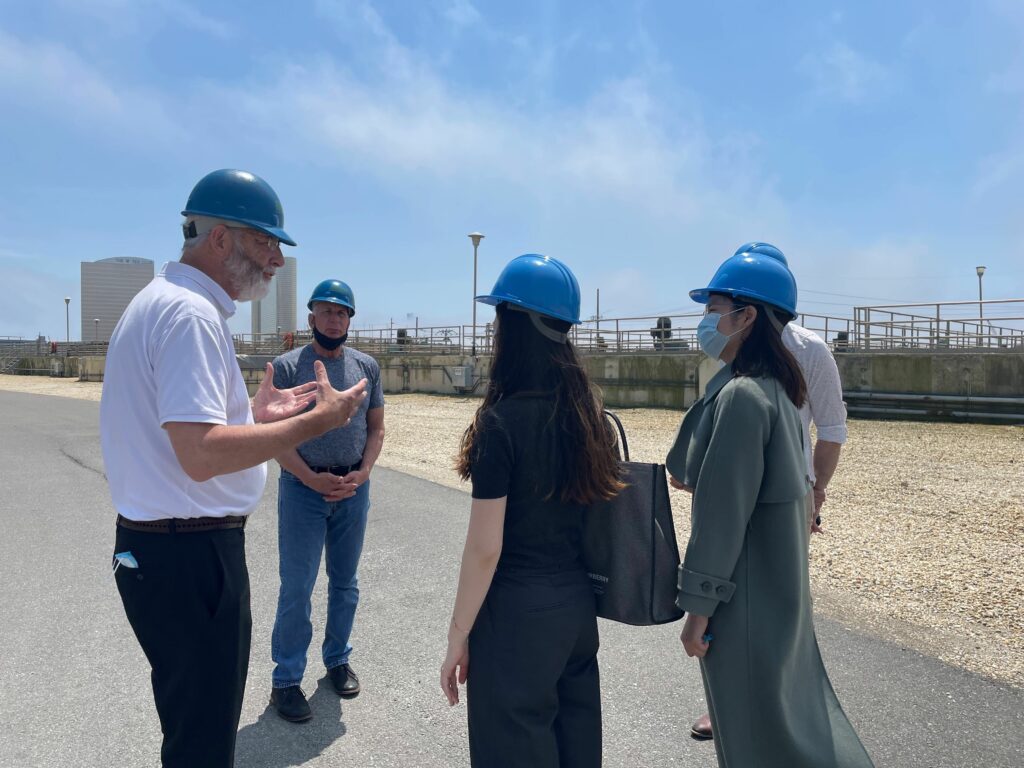
Project Plastic was moved by the third approach to develop the world’s first portable, affordable, and environmentally friendly microplastic measuring and sequestration device. Project Plastic is a team of chemists and architectural designers, but we aren’t just a filtration technology company. Driven foremost by the microplastic problem, we follow microplastics to the end of their aquatic lifetime. We strive to collaborate with riverkeepers, water treatment companies, and private bottled water companies to monitor, collect, and upcycle microplastic pollution from waterways. 

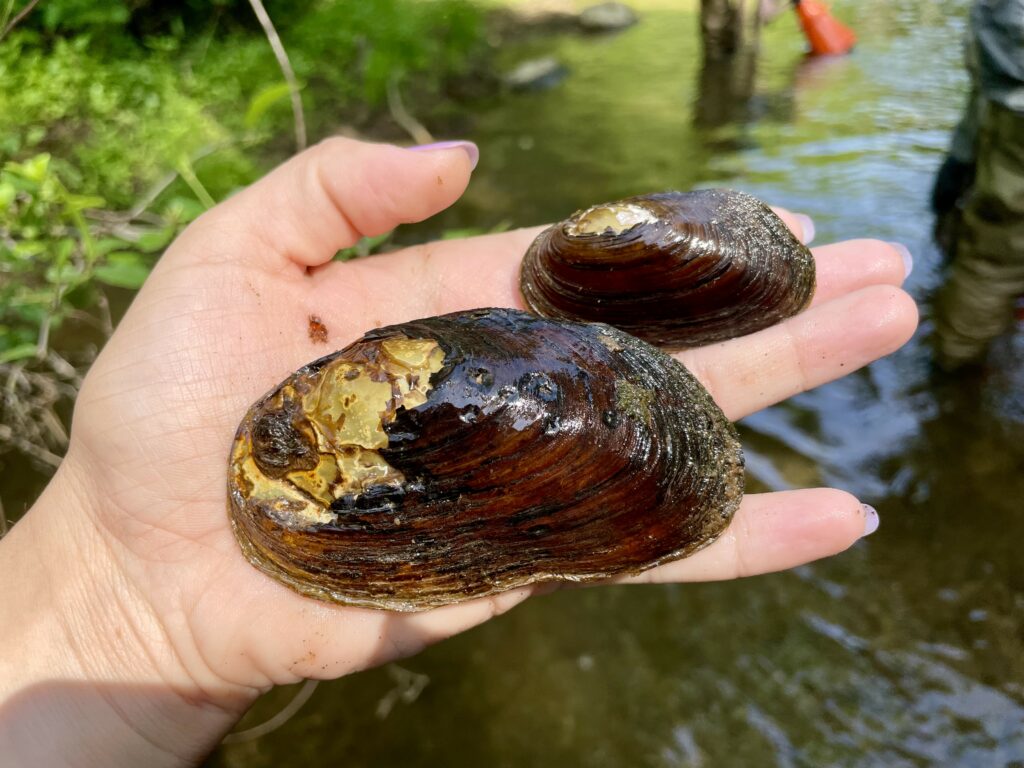
Our device utilizes a patented ‘artificial root’ technology that acts as a filter to remove small debris (including microplastics) from the upper water column, where most plastic pollutants accumulate. Our root technology is modeled after organic aquatic plant roots. Long fibrous filaments are suspended in water and sediments physically adhere to the dense fibers on each root. Naturally-occurring biofilms accumulate on the ‘artificial root’ network over time, which further traps small particles. By applying an array of ‘artificial roots’ to the underside of a flotational frame, our device can entrap large quantities of microplastics while allowing aquatic wildlife to swim below or between our filter. Each biofilter is attached to a removable pad, making it easy to swap biofilters once they become saturated. Each pad is housed within a hydrodynamic flotation frame for application in rivers, streams, and reservoirs.

The Plastic Hunter: a portable, affordable microplastic filter inspired by plant roots. Image created by Project Plastic

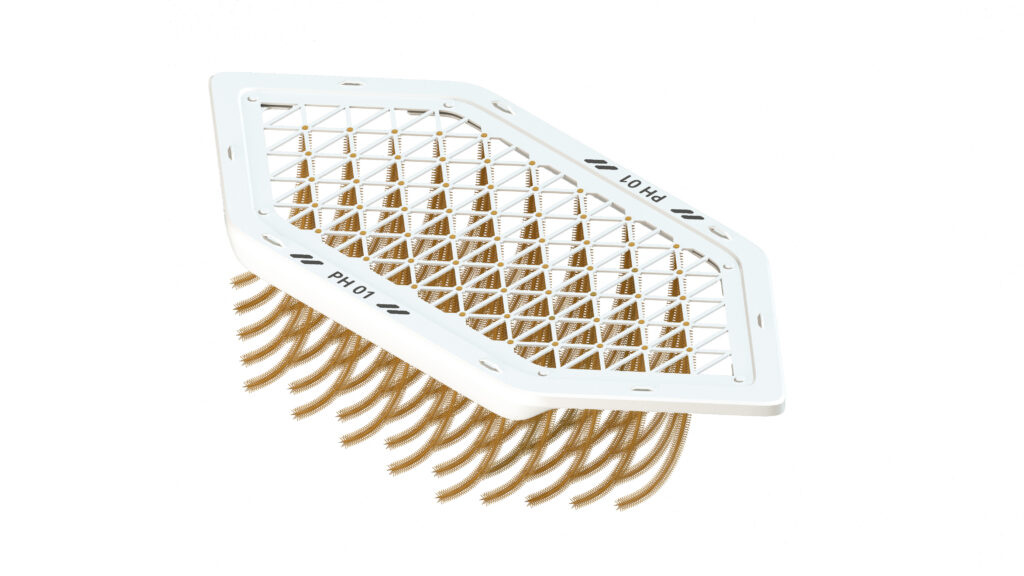
The Plastic Hunter has a key advantage over conventional filtration technologies: it has no mechanical components, meaning it can operate passively with no electricity and minimal maintenance. This makes the device far cheaper to produce, deploy and maintain compared to any existing microplastic filtration system.

Lastly, our team is currently working on establishing protocols for the separation and purification of contaminated sediments from our filter media. In doing so, our team hopes to extract relatively pure microplastic sediments from our devices to be forwarded to our research collaborators at the University of Washington in St Louis. The aim is to develop a method of converting microplastics into chemical compounds like carotene. If successful, our team may be able to upcycle microplastics into useful chemicals for other industries like pharmaceuticals, turning harmful waste into sustainable resources. This, we hope, will avoid environmentally harmful storage or processing of contaminated sediment through incineration, and instead propagate a circular economy for microplastic waste.

— By Amy Amatya of Project Plastic

Filed Under: Nature, Science, Watershed

Microplastics: The ever present contaminant

July 20, 2022 By Watershed Protection Team

By Watershed Protection Program Co-Op Vincent Liu

Large-scale plastic production has been around since the 1950s, and while plastics existed prior, it was not until this time where plastics began making their way into many aspects of life. With the rise of plastic as a popular material, microplastics emerged as a new contaminant. Microplastics are small pieces of plastic, less than 5mm in size, and they are everywhere. In even the most remote waters of Earth, microplastics can be found. Microplastics are not a recent environmental concern as they have been extensively studied in the marine environment. The presence and impact of microplastics on freshwater ecosystems, however, has been a topic of interest in recent years. With its ability to persist in the environment and being incredibly difficult to remove efficiently, microplastics have established themselves as a worrying pollutant.

Microplastics are formed when larger pieces of plastic break apart into smaller ones. They can come from a wide variety of sources, such as textiles, industry, and packaging. Single-use plastics that reach the environment gradually break into microplastics that can then wash into a stream from a storm event. Plastic fibers are easily shed in the washing machine and then end up in wastewater that enters streams and rivers. These are just some of the many ways that microplastics are released into water. The biological effects of microplastics are yet to be clearly defined, but harmful impacts have been found in studies involving freshwater fish and bottom-dwelling macroinvertebrates. Macroinvertebrates are small animals that lack a backbone, and some species are often used by scientists as indicators of stream health. A study by Redondo-Hasselerharm et. al in 2018 showed that the impact of microplastics on macroinvertebrates is species dependent, with some species being highly sensitive to microplastics and others not being affected at all. Specific health effects were also found in fish including liver damage and reduced growth.

I did my senior project on observing microplastics in Pennsylvanian streams while working with the environmental policy organization, PennEnvironment, on their citizen science microplastic project. PennEnvironment staff collected samples while I assisted in processing samples and analyzing the data. The samples were collected in glass jars, to help reduce the plastic contamination, and were run through a filtration system that draws the water sample through a filter, leaving just the suspended solid material from the water. The filter is placed under a microscope to detect the presence of microplastics within the sample. The 4 categories of microplastics that this project looked for were fibers, fragments, films, and beads. Fibers are long, thin strands of plastic that usually come from textiles. Films are flat, wide, and typically transparent. Beads are round spheres, often found in personal care products prior to 2015. Fragments are plastics that do not fit any of the other categories. A microplastic was distinguished from a natural material by using the squish test, which is a simple test done by poking the suspected microplastic with tweezers. Plastic will not break. It will either maintain its shape or mold into a different shape. 

Example of a microfiber viewed under a microscope. Photo by Caitlin Wessel

The results of the project confirmed the presence of microplastics in every stream that was sampled. What was particularly interesting was the low amount of microbeads compared to every other category of plastic. Beads were by far the least common category of microplastic. This can most likely be attributed to the Microbead-Free Waters Act in 2015, which banned plastic microbeads in rinse-off cosmetics. It was also notable that samples had wildly varying amounts of microplastic, though concentration was not calculated for this project. The site photos from where the samples were collected often told a story as well. In one of the sites, there was a blue tarp that was hanging from a tree into the stream just upstream of the collection site. During microplastic analysis for that sample, there was a noticeably high count of blue microfibers. 

Filtration system used to filter microplastic from water and the jars that samples are stored in

Finding ways to remediate microplastic already existing in the environment is an ongoing pursuit, but policy changes can reduce microplastic output from the source. The microbead ban leading to almost a complete disappearance of microbeads in waterways is an example of how legislation can lead to reductions of microplastic contamination. Policy changes in reducing unnecessary plastic usage and encouraging the use of alternative materials will reduce the amount of microplastics entering the streams. After over 70 years of mass plastic production, it may be time to switch gears and look for alternatives. 

— By Watershed Protection Program Co-Op Vincent Liu

References

Parker, B., Andreou, D., Green, I. D., & Britton, J. R. (2021). Microplastics in freshwater fishes: Occurrence, impacts and future perspectives. Fish and Fisheries, 22(3), 467–488. https://doi.org/10.1111/faf.12528

Redondo-Hasselerharm, Paula E., et al. “Microplastic Effect Thresholds for Freshwater Benthic Macroinvertebrates.” Environmental Science & Technology, vol. 52, no. 4, 30 Jan. 2018, pp. 2278–2286, https://pubs.acs.org/doi/10.1021/acs.est.7b05367 

Eerkes-Medrano, D., Thompson, R. C., & Aldridge, D. C. (2015). Microplastics in freshwater systems: A review of the emerging threats, identification of knowledge gaps and prioritisation of research needs. Water Research, 75, 63–82. https://doi.org/10.1016/j.watres.2015.02.012

Birch, Q. T., Potter, P. M., Pinto, P. X., Dionysiou, D. D., & Al-Abed, S. R. (2020). Sources, transport, measurement and impact of nano and microplastics in urban watersheds. Reviews in Environmental Science and Bio/Technology, 19(2), 275–336. https://doi.org/10.1007/s11157-020-09529-x

Geyer, R., Jambeck, J. R., & Law, K. L. (2017). Production, use, and fate of all plastics ever made. Science Advances, 3(7). https://doi.org/10.1126/sciadv.1700782

Center for Food Safety and Applied Nutrition. “The Microbead-Free Waters Act.” U.S. Food and Drug Administration, 2018, www.fda.gov/cosmetics/cosmetics-laws-regulations/microbead-free-waters-act-faqs.b 

Filed Under: Education, Plastic Free July, Watershed

The Burden of Expanding Plastic Production and Use: A Great Product or a Horrific Product? Your Choice

July 13, 2022 By Watershed Protection Team

By Carol L. Armstrong, Ph.D., ABN, Friends of Heinz Refuge, Board of Directors
Cover Photo by Jennifer Mathes

Did you know that right here in our region, we have a wildland that supports over 300 species of birds, of which you will see and hear over 40 on any day? The marshes at the John Heinz National Wildlife Refuge spanned almost 6,000 acres in the time of Lenape stewardship of the land, and now it consists of 1,000 acres where massive biodiversity exists, some endangered species survive, and beautiful streams flow into tidal wetlands. It is a place where you can feel you can get lost, all the time being but a stone’s throw from Philadelphia and the dense suburbs of Delaware County. But there is a hidden problem: plastic debris is inundating the Refuge (Photo copyright: Kim Sheridan).

Darby Creek. Photo Copyright: Kim Sheridan

To manage the plastic debris, the Refuge has both public and non-public clean-ups throughout the year. Volunteers help Refuge staff to remove the hundreds of tires, layers of plastic debris on flood plains, plastic stuck in the riparian trees and shrubs after a storm, and thick accumulation of plastics in coves, marsh, and aquatic plants. The problem is most apparent at low tide (photo copyright: Mary Trzeciak). 

Plastics found during low tide. Photo Copyright: Mary Trzeciak

How do we prevent this sort of pollution? Personal evolution comes from reading about the problem, watching the webinars from the Friends of Heinz Refuge (see videos on our Facebook), reading the Friends of Heinz Refuge e-Newsletter, and joining our Plastics Working Group meetings, held monthly. 

One of our Board members, whose career was in business and not involved in environmental restoration, recently admitted that his view of plastic had changed completely since he joined the Board, and now he “can’t stand plastic.” He is horrified at the stuff, and now refuses to purchase plastic drinking containers. 

In three of the public cleanups at the Refuge, volunteers sorted the types and number of debris using the Ocean Conservancy’s data form. Of plastics, metal, glass, and paper debris, more than 99% were some form of plastic, which, over the next hundreds of years, will flake off microplastics and leach into the water the chemicals that make plastic have the features producers want (e.g., color, flexibility, weight, heat/light resistance), long before the plastic actually decomposes back into organic matter. Plastics begin to break down into microplastics and leach chemicals as soon as they are in the environment.

It’s difficult to make the paradigm shift that this board member made, because we are so accustomed to thinking that we cannot live without plastics. The 4% increase in the production of plastics each year means that it is increasing due to supply and not due to demand. The increasing number of items that are packaged in plastic can be witnessed in any store, often in multiple layers of plastic. For example, cheeses are sold in see-through plastic boxes rather than wrapped in paper, bakery items are all packaged in some amount of plastic, condiments and drinks leave few choices in glass rather than plastic, and organic produce is difficult to find without plastic packaging. There are zero waste businesses dedicated to transforming industries to reusable containers or alternate materials, and they find the uphill road very steep. 

In the U.S., plastic that is recycled has declined from 7 to 9% to 5 to 6%, according to the most recent reports from the EPA and the U. S. Department of Energy. 100% of plastic waste is incinerated in some towns such as Harrisburg, and this practice is  increasing in many cities. Some “chemical recycling” is emerging from burning plastics for energy, which increases the demand for plastic waste, results in more toxic air pollution, and increases greenhouse gas emissions. By 2050, humans will have produced more than 28.5 billion tons of plastic, and we will be dealing with four times more plastic production than currently exists. Borrowing from L-M Miranda’s Hamilton: “Do you support this Earth? Of course. Then defend it.”

The key is to remember that there is always something that each person can do: 

  1. Make purchasing decisions based on the presence or relative amount of plastic in the packaging; 
  2. Do your own home assessment of the sources and amounts of your waste versus recycling (now in Pennsylvania mainly limited to clear or white #1 and #2). The EPA and California provide online instructions for zero waste practices, and a simple site for home is: https://www.thezerowastecollective.com/post/how-to-do-a-trash-audit-at-home;
  3. Work towards cutting in half (or more) the amount that you put out in trash and recyclables;
  4. Avoid plastic sheeting and synthetic textiles used in landscaping, sediment/erosion control, blankets and rugs, and personal clothing as these plastics are filling our air, soil, and water, and there are alternatives for all.  The presence of plastics in our indoor air is disturbing at estimates of 30% of dust;
  5. Give up thin, single-use plastic bags and drinking containers forever; and
  6. Ask your town to ban single-use plastics. 

— By Carol L. Armstrong, Ph.D., ABN, Friends of Heinz Refuge, Board of Directors

Filed Under: Education, Plastic Free July, Watershed

The Tale of Two Streams

June 25, 2022 By Anna Willig

Every four weeks, the Watershed Protection Program heads over to East Goshen to visit two branches of Ridley Creek near the Goshenville Blacksmith Shop. We trudge down the road to our first site, RC1, which lies in the main stem of Ridley Creek. We hop in the creek, take measurements, collect samples, and then we walk about 150 feet to our next site, WBRC1, West Branch Ridley Creek, where we do it all over again. Even though these two sample sites are right next to each other, WBRC1 is in a completely different creek. Just downstream from these two sample sites, the West Branch merges into Ridley Creek, and the waters from the sample sites flow together as one.

Ridley Creek

In many ways, these two streams are identical. The amount of water flowing through them is nearly the same. Also similar in size is the size of land they drain. Their banks are lined by both trees and shrubs, with a few patches of clearing. The stream beds are rocky along with some sand and mud near the banks. Given all of these similarities, it would be easy to imagine that the water quality is similar at these two sites, as well.

image preview
West Branch Ridley Creek

However, as the Watershed Protection Team discovered, once we started looking at the water chemistry, we found that the two streams are quite different. Immediately, we noticed differences in specific conductivity. Specific conductivity measures the ease at which electricity can move through water, and pure water is a terrible conductor, meaning it has low specific conductivity. So when we find that specific conductivity is high in water, then that tells us that there are pollutants present. Comparing WBRC1 and RC1, we found that the specific conductivity is much higher in WBRC1 than RC1, meaning the water quality is much lower in WBRC1. However, specific conductivity cannot tell us which pollutants are in the water–it can only indicate that there are pollutants.  

Specific Conductivity Data for RC1 and WBRC1

Looking deeper into the chemistry, we found that WBRC1 contains higher concentrations of chlorides, nitrogen, and phosphorus, all of which increase specific conductivity. So where are they coming from? For chlorides, the answer is road salts. After road salts are applied in winter, they runoff into streams and groundwaters, where they can persist throughout the year, leading to higher concentrations of chlorides year round. For nitrogen and phosphorus, the answer is a little more complicated. They can come from a few different sources, most commonly fertilizers, leaky septic and sewer systems, and animal waste. Elevated concentrations of chlorides, nitrogen, and phosphorus are concerning because these pollutants can threaten the survival of sensitive stream organisms, such as mussels, trout, and stream insects. 

RC1 and WBRC1 Chloride Data

However, this poses more questions: why are there higher concentrations of salts and nutrients at WBRC1? How could water chemistry at two sites only 150 feet apart from each other be so different? To understand where these contaminants are coming from, we needed to look at what is going on in the land upstream of each sample site. And what we found is a difference in impervious surfaces.

Phosphorus Bar Graph
Nitrogen Bar Graph

Impervious surfaces are any surfaces that water cannot directly pass through, such as roads, sidewalks, parking lots, driveways, and buildings. These surfaces have several direct and indirect impacts on water quality. Many impervious surfaces are treated with road salt in the winter, and any rain or snow that hits these surfaces will carry that salt into the stream, increasing chloride concentrations. Impervious surfaces also reflect human activity in an area. Generally, the more impervious surfaces in an area, the more humans, and with more humans comes more fertilizer applications on lawns and gardens and more septic and sewer systems, all of which can flow into streams. As a result, there is a strong relationship between the amount of impervious surface cover and the pollutants that drain into a stream system.

We found that of the land that drains into WBRC1, 20% of that area is covered by impervious surfaces, as compared with RC1, where only 14% of the area is covered by impervious surfaces. While 6% may seem like a small difference, it is large enough to account for the difference in water quality of these two streams. This tells us that for Ridley Creek to maintain its health and water quality, we need to strive to stay below 20% impervious surfaces, and maybe even less than that. 

image preview
Catchments draining into West Branch Ridley Creek (WBRC1) and main stem Ridley Creek (RC1) sampling sites. Note the dense impervious surface cover in the WBRC1 catchment compared to the RC1 catchment.

The story of these two streams can be a hopeful one, and there are many lessons to be learned. If we can keep the amount of impervious surfaces down, we can protect water quality, even at an incredibly local scale. The more land we can protect as open space, the better the water quality in our streams and rivers. 

In addition to protecting land, we as individuals can also reduce the impact that impervious surfaces have on streams by doing the following:

  1. Limiting the amount of road salt used in the winter or sweeping up road salt after storms pass. This is a great way to reduce the amount of salt entering streams. 
  2. Reducing fertilizer use and avoiding applying fertilizers before rainstorms.
  3. Planting rain gardens alongside roads and driveways to help collect and filter stormwater, further reducing the amount of salts and nutrients entering streams. Native flowers, shrubs, and trees are great at absorbing excess nutrients and salts before they enter streams, and planting more of these plants will go a long way towards improving water quality.  
  4. Finding more tips here: Healthy Streams Start with Healthy Landscapes.

No matter how far away you are from a stream, any action you can take will make a difference.  

— By Watershed Conservation Associate Anna Willig

Sources:

Baker, M. E., Schley, M. L., & Sexton, J. O. (2019). Impacts of Expanding Impervious Surface on Specific Conductance in Urbanizing Streams. Water Resources Research, 55(8), 6482–6498. https://doi.org/10.1029/2019WR025014

Morse, C. C., Huryn, A. D., & Cronan, C. (2003). Impervious Surface Area as a Predictor of the Effects of Urbanization on Stream Insect Communities in Maine, U.S.A. Environmental Monitoring and Assessment, 89(1), 95–127. https://doi.org/10.1023/A:1025821622411

Filed Under: Nature, Science, Watershed

A Cycle of Give and Take

June 24, 2022 By Watershed Protection Team

By Watershed Protection Program Co-Op Sarah Busby

Within our streams, there are many players that work to create a functioning, thriving ecosystem. From the tall trees that hang overhead at the bank’s edge, providing cooling shade and abundant habitat, to charismatic animals like the beaver that literally shape the movement of the stream, some species play a more visible role than others. However, there are plenty more individuals hard at work behind the scenes, — or rather, below the surface of the stream. One such character is the freshwater mussel. Sometimes mistaken for a stone, this unassuming animal quietly resides at the bottom of our streams, often going unnoticed. While an individual mussel may be overlooked, their dramatic impact on a stream is impossible to miss when they work together.

One of many Elliptio complanata mussels found in our very own Crum Creek during a recent mussel survey. Photo by Sarah Busby

Freshwater mussels begin their life in a curious fashion, highly dependent on the fish in their communities. During reproduction, female mussels release packets of larval mussels, or glochidia, carefully timed with the encounter of a suitable host fish. After release, the larval mussels must attach to the gills of their host to survive. Once the larvae have secured a ride, they will travel with their host until they grow big enough to go off on their own, which may take up to a few weeks. When ready to depart, the mussels drop off and settle down into the riverbed. Host fish not only provide a safe haven for the larval mussels to develop in, but also allow for them to disperse much greater distances than freshwater mussels could ever go on their own. While glochidia do not cause harm to their host in most cases, the obligate parasite owes much to the hosts they grow up in. Though freshwater mussels are quick to give back to their neighbors once they come into adulthood.

Freshwater mussels are constantly filtering through water to breathe and feed. Typically, they sit partially buried into the substrate, siphoning in water. As water flows through their gills, they filter out bacteria, algae, phytoplankton, detritus, and other small organic particles to feed on. In this process, they also filter out pollutants from the water, accumulating the contaminants into their own bodies.

The filter-feeding activities of mussel populations greatly improves the water quality of the bodies of water they inhabit. This is beneficial to the rest of their local community. The fecal pellets they expel provide food for other invertebrates, and the mussels themselves are consumed by fish, birds, and mammals alike. Additionally, their shells provide shelter and habitat for aquatic invertebrates like caddisflies, midges, and other insects that fish rely on for sources of food. Much like the fish who sheltered them in their vulnerable state, an adult mussel provides for its community throughout its entire lifetime of up to a century, and even beyond when only its shell remains.

Mussel by Sarah Busby

Freshwater mussels have a long history of providing not only for their aquatic communities, but for humans as well. These mussels were a major food source for many prehistoric [1] and pre-colonial people in North America. Multiple Native American tribes have mussel harvests that date back to over 10,000 years ago. The shells were used for creating tools and jewelry. Before the invention of plastic, buttons were also made from the shells of mussels. The mentioned uses were in addition to the ecological service mussels provide by improving the quality of our water sources. While the cultural use of mussels has shifted over time, this critical service upholds its relevance.

Now in modern times, freshwater mussels are more vulnerable than ever before. From habitat degradation, pollution and impaired water quality, mussels face threats on multiple fronts — many of which are human imposed. As many native host fish species decline, the mussels follow close behind.

Currently, freshwater mussels are considered the most endangered group of organisms in [2] the country. It is our turn to provide for the mussels and the communities that come with them. Protecting the mussels means protecting our rivers and streams. Current efforts are being made to reintroduce [3] freshwater mussels into our streams and foster their growth through research and restoration. But success of these efforts is brought to fruition through community support. It starts with appreciating the role mussels play in a thriving ecosystem and follows by embracing our own part in it.[4] 

— By Watershed Protection Program Co-Op Sarah Busby

Sources:

About freshwater mussels. Pacific Northwest Native Freshwater Mussel Workgroup. (n.d.). Retrieved June 6, 2022, from https://pnwmussels.org/about-freshwater-mussels/

Freshwater Mussels. Center for Biological Diversity. (n.d.). Retrieved June 6, 2022, from https://www.biologicaldiversity.org/campaigns/freshwater_mussels/

Freshwater mussels. Partnership for the Delaware Estuary. (2020, July 17). Retrieved June 6, 2022, from https://delawareestuary.org/science-and-research/freshwater-mussels/

Jaramillo, C. (2018, May 2). With nation’s first city-owned Mussel Hatchery, Philly employing bivalves in battle to improve water quality. WHYY. Retrieved June 6, 2022, from https://whyy.org/articles/with-nations-first-city-owned-mussel-hatchery-philly-employing-bivalves-in-battle-to-improve-water-quality/

Mussels and Us Prehistory. FMCS – Freshwater Mussels. (n.d.). Retrieved June 6, 2022, from https://molluskconservation.org/MUSSELS/Prehistory.html

Strayer, D. L. (2017). What are freshwater mussels worth? Freshwater Mollusk Biology and Conservation, 20(2), 103–113. https://doi.org/10.31931/fmbc.v20i2.2017.103-113

Wimberly, B. (2021, August 26). The “mussel” Behind the delaware river watershed’s clean water. Audubon Pennsylvania. Retrieved June 6, 2022, from https://pa.audubon.org/news/%E2%80%9Cmussel%E2%80%9D-behind-delaware-river-watershed%E2%80%99s-clean-water


Filed Under: Nature, Watershed

  • « Previous Page
  • 1
  • …
  • 3
  • 4
  • 5
  • 6
  • 7
  • …
  • 14
  • Next Page »

CONTACT

925 Providence Road
Newtown Square, PA 19073
(610) 353-2562
land@wctrust.org

JOIN OUR MAILING LIST

Copyright © 2025 · WCTRUST.ORG