WILLISTOWN CONSERVATION TRUST

  • Facebook
  • Instagram
  • LinkedIn
  • YouTube
DONATE
  • About
    • HOW WE WORK
    • WHERE WE WORK
    • OUR STAFF AND TRUSTEES
    • JOBS & INTERNSHIPS
    • VOLUNTEER
    • RUSHTON CONSERVATION CENTER
    • STRATEGIC PLAN
    • DIVERSITY, EQUITY & INCLUSION STATEMENT
    • FAQs
  • LATEST
    • BLOG
    • IN THE NEWS
    • PUBLICATIONS
    • PHOTOS
  • PROGRAMS
    • BIRD CONSERVATION
    • COMMUNITY FARM
    • EDUCATION
    • LAND PROTECTION
    • STEWARDSHIP
    • WATERSHED PROTECTION
  • NATURE PRESERVES
    • ASHBRIDGE PRESERVE
    • HARTMAN MEADOW
    • KESTREL HILL PRESERVE
    • KIRKWOOD PRESERVE
    • RUSHTON WOODS PRESERVE
  • EVENTS
    • EVENT CALENDAR
    • BARNS & BBQ
    • RUN-A-MUCK
    • WILDFLOWER WEEK
    • ECOCENTRIC EXPERIENCE
    • RUSHTON NATURE KEEPERS (RNK)
    • ACCESS Program
  • Support
    • WAYS TO GIVE
    • SPONSOR THE TRUST
    • CORPORATE PARTNERSHIP PROGRAM
    • JOIN THE SYCAMORE SOCIETY
    • LEGACY SOCIETY & PLANNED GIVING
  • CAMPAIGN FOR KESTREL HILL PRESERVE

A Macroinvertebrate’s Thanksgiving Feast

November 16, 2021 By Anna Willig

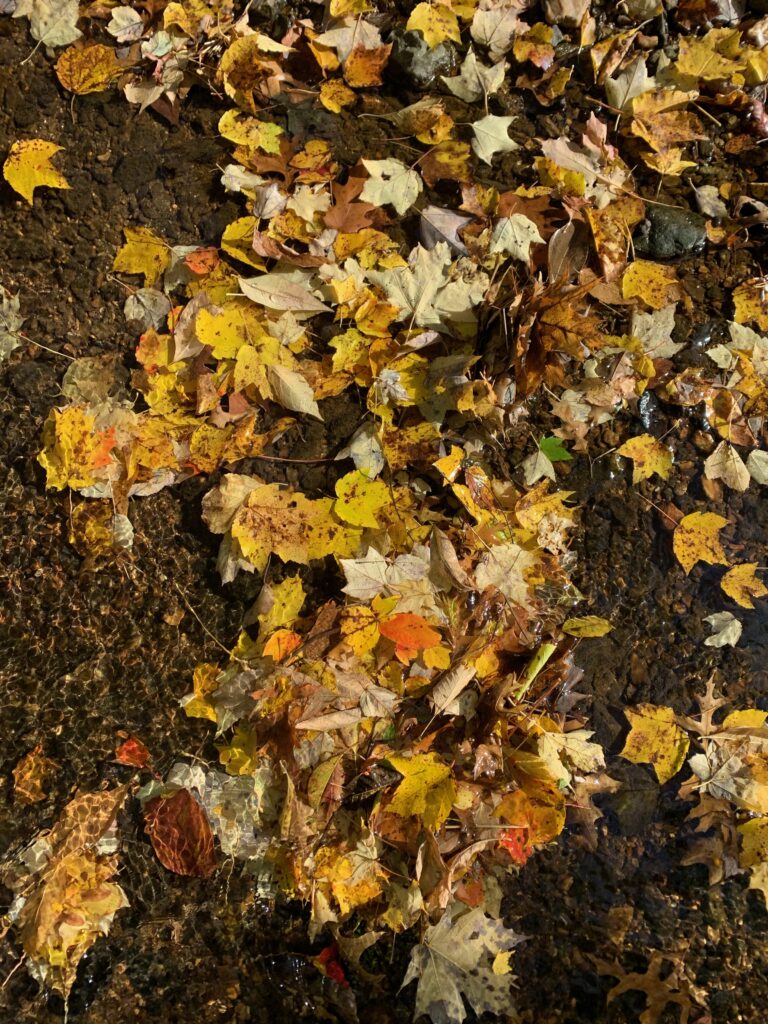
Each fall, trees provide a veritable Thanksgiving Feast for aquatic macroinvertebrates. They spend the whole spring and summer preparing this feast, growing it, maintaining it, making sure everything is just right, and, come fall, dropping it all in the stream. What is this feast? Leaves!

Leaves from trees and shrubs are a form of allochthonous input, or something that enters an ecosystem from outside of the system. In small headwater streams, such as those found in our area, allochthonous input is a dominant source of energy, essentially forming the base of the food chain. Generally, these small headwater streams are forested, preventing light from reaching streams, inhibiting photosynthesis, and thus limiting the growth of aquatic plants. Consequently, the main source of energy in these streams comes from trees in the form of fallen leaves.

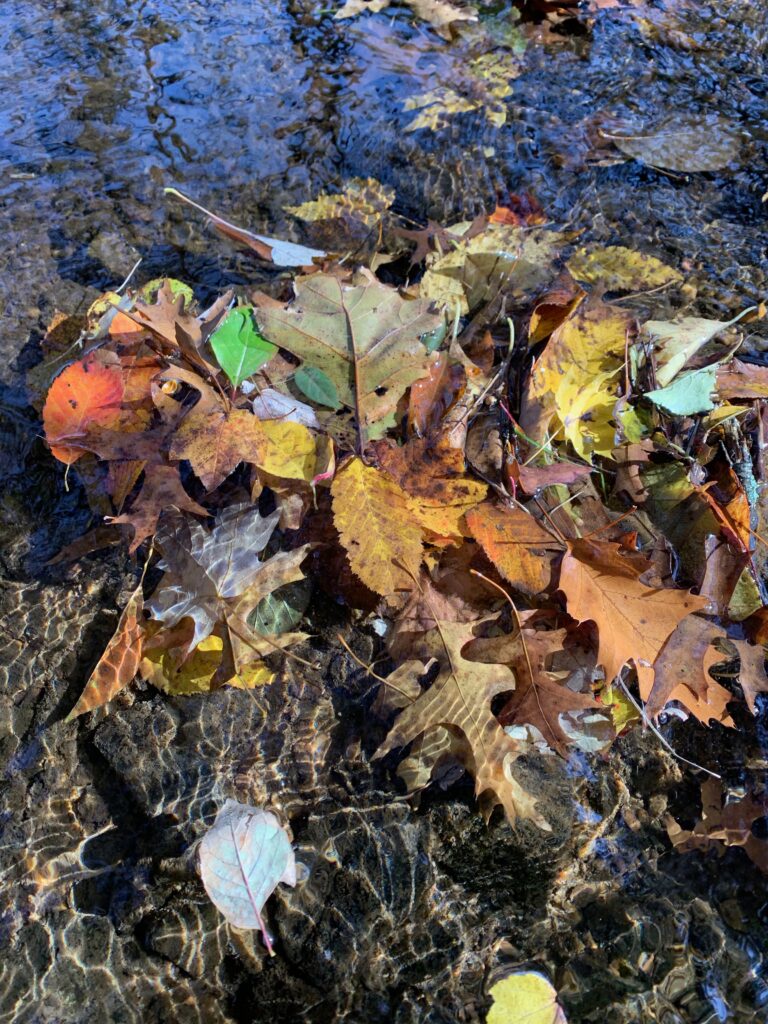
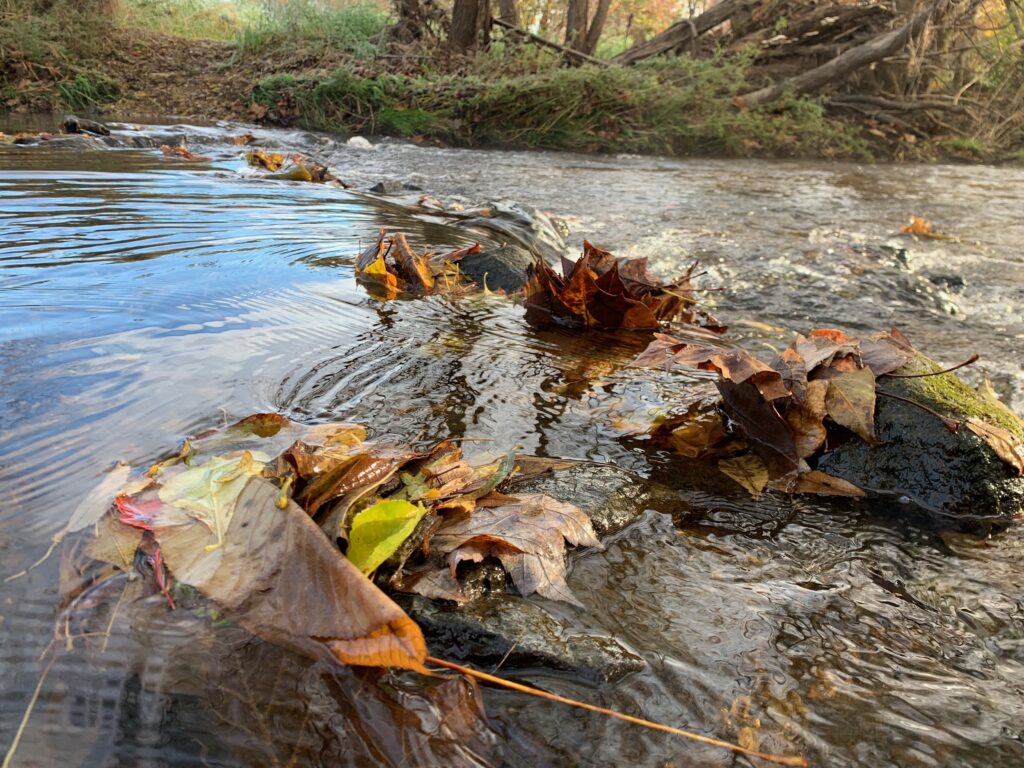
Once leaves fall into the stream, microbes, such as bacteria and fungi, colonize leaves, starting the process of decomposition. Some macroinvertebrates, called shredders, eat the leaves themselves, feasting on the plant material. Other macroinvertebrates, called scrapers, eat the layer of algae, bacteria, and fungi that develops on fallen leaves. Both shredders and scrapers are eaten by predatory macroinvertebrates, which are in turn eaten by frogs, salamanders, fish, and other aquatic animals, moving energy up the food chain.  

Leaf litter in streams also provides important habitat for macroinvertebrates. Smaller macroinvertebrates can hide from predators in the leaf litter, while predatory macroinvertebrates can hide from unsuspecting prey in the leaf litter as well. 

Since leaf litter is so important for macroinvertebrate communities, any changes to the amount and type of leaf litter that reaches the stream can impact the macroinvertebrate community. In areas where trees have been cleared along stream banks, the primary energy input is no longer leaf litter. Rather, since sunlight can reach the stream, aquatic algae and vegetation will grow more readily and become the dominant source of energy. As a result, the macroinvertebrate community will shift to a community that primarily eats aquatic vegetation and algae, with consequences for the entire food chain. Similarly, if the composition of riparian vegetation changes and non-native plants become more common than native plants, the macroinvertebrate community may shift as well. 

The best way to maintain and improve this Thanksgiving Feast for our aquatic life is to protect forests along streams, remove invasive species, and plant native trees along streams. Willistown Conservation Trust is working to enhance this feast at Ashbridge Preserve, where we have planted over 1000 trees along Ridley Creek. We hope that these trees will improve water quality and contribute much needed allochthonous input for the inhabitants of Ridley Creek.

By Anna Anna Willig | she/her | Watershed Conservation Associate | As part of our Watershed Protection Program, Anna assists with monthly water chemistry sampling, maintains the tree planting at Ashbridge Preserve, and analyzes water quality data from sampling and from our EnviroDIY sensors.

Filed Under: Amphibian conservation, Nature, Science, Watershed

Flooding 101

August 23, 2021 By Anna Willig

As we approach the last few weeks of summer heat and humidity, we approach peak seasons for thunderstorms and flooding. Last Thursday, heavy rainfalls led to the first major flood of the year in our area. At Ashbridge Preserve, Ridley Creek rose over 2 meters (7 feet) in about 3 hours, pouring out of its banks. In the wake of these floods, we wanted to take the opportunity to answer some commonly asked questions about the fundamentals of flooding.

What is a flood?

The United States Geological Survey (USGS) defines a flood as “any relatively high streamflow overtopping the natural or artificial banks in any reach of a stream” (USGS, 2019). In other words, a flood happens when a stream breaches its banks, resulting in water flowing over areas that are not normally part of the stream. Floods can occur for a number of reasons, from snow melt to rain to changes in tides. In our area, the most common cause of flooding is rain, often from summer storms, and snow melt after large snowfalls.

Ridley Creek before (left) and during (left) a flood at Ashbridge Preserve in 2018. Photos by author.

How frequently do floods occur? 

Floods can occur several times a year, whenever rain or snowmelt causes a stream to overflow its banks. Small floods, when the stream barely breaches its banks, are more common than large floods when the water pours out of its banks.

The size of a flood is determined by the peak flow of a stream or the greatest amount of water moving through the stream during a flood event. Peak flow can be determined by measuring the height of a stream; it is the highest height during the flood event. Higher peak flows indicate larger floods and lower peak flows indicate smaller floods.

This graph shows water depth over time and nine floods that happened at Ashbridge Preserve in the Summer of 2018. The blue line represents the depth at which the stream completely fills its bank–a flood occurs any time the water rises above this depth. Each spike represents a rainstorm and the peak flow, which determines the size of a flood, is the highest depth in each storm. The star represents the peak flow of the flood that is pictured above.   

Floods are classified by how often we expect them to occur. A 100-year flood is a flood of a given size that has a 1% chance of occurring each year. Similarly, a 500-year flood has a 0.2% chance of occurring each year and a 1000-year flood has a 0.1% chance of occurring each year. However, this does not mean that a 100-year flood will only occur once every 100 years or that a 1000-year flood will occur once every 1000 years. It simply refers to the likelihood of such a flood happening each year. 

How do you stay safe during a flood?

Floods in our area can be dangerous, even life-threatening. According to a recently completed Hazard Risk Assessment by Chester County, flooding is the second highest risk hazard in the county. Floods can damage property, destroy roads and bridges, and threaten human lives. 

Floodwaters are most dangerous for drivers, especially when drivers try to cross flooded roads. Twelve inches of flowing water will move a car, and 2 feet of water will easily sweep a car away. Even just a few inches of water can immobilize a car, stranding drivers in the middle of a road. If you are driving during a rainstorm, do not drive through any floodwater. Floodwater is often dark and murky, making it difficult to judge how much water is actually on the road and if the water is flowing. Turn around and find another route or pull over and wait until the water goes down.

Want to learn more about flooding?

Stay tuned next week for Flooding 102, which takes a deeper dive into how land use decisions impact flooding in our area. Until then, check out some of these resources:

  • Monitor streams in Pennsylvania for real-time flooding: Streamflow conditions 
  • Check out real-time stream monitoring data in Ridley and Crum Creeks near Willistown: EnviroDIY Sensor Stations
  • Learn more about flood risk and historical flooding in Chester County: Risk Assessment – Flood, Flash Flood, Ice Jam
  • Learn more about how to stay safe during a flood: Turn Around Don’t Drown

USGS. (2019). Floods and Recurrence Intervals: Overview [Techniques and Methods]. USGS.
https://www.usgs.gov/special-topic/water-science-school/science/floods-and-recurrence-intervals?qt-science_center_objects=0#qt-science_center_objects

Filed Under: Conservation, Education, Land Protection, Science, Watershed Tagged With: pollution

Shining a Light on a Different Type of Stream Pollution

August 11, 2021 By Zack Smith

Lights are everywhere around us and have many uses, often at night, that benefit our health and safety. We put lights on our cars, buildings, and roads, often neglecting to understand their full effect beyond their positive impact on human life. While lights may make us feel more comfortable in our surroundings, they have been known to negatively impact other species in our environment through the process of light pollution. 

Light pollution occurs when the excessive use of light creates an overwhelming glow in the night sky that brightens the natural environment, often exceeding even the bright glow of a full moon. This form of pollution is all encompassing, as 83% of the world population lives in an area that experiences light pollution. In the USA and Europe, 99% of the population lives under a polluted night sky. If you are interested in seeing what light pollution looks like in your hometown, check out this website. 

This image from https://www.darksky.org/light-pollution/ shows the potential pollution caused by lights in residential areas. All lights are used to light a specified area, but as seen in the image above, more areas outside of the area to be lit also experience glare.

Researchers have observed nocturnal animals that rely on dark skies and lunar cycles will change their activity levels in areas with more light pollution. Animal behavior has adapted to natural conditions over millions of years, and when we suddenly put in millions of lights, we are changing the environment species need to thrive. Perhaps the most common example of this is the case of the sea turtle. Hatching sea turtles rely heavily on the moon to find the ocean shortly after emerging. In highly polluted areas, the lights from the land often mimic or overpower the moon and deceive the babies, leading them towards land where they are bound to get hit by cars, eaten by predators, or starve to death (Longcore & Rich, 2004). 

Locally, different species feel the burden of light pollution. Studies on streams across the USA have shown that light pollution near streams can change the makeup of insect populations in and around streams. Streamside studies where artificial light pollution was introduced demonstrated that important spiders often living in riparian zones decreased in abundance, as did the diversity of aquatic insects, by as much as 16%. Light pollution near streams also led to a decrease in size in emerging insects by approximately 76% (Meyer & Sullivan, 2013).  

Changing conditions in streams can have a large ripple effect outside of the water, too. With individuals disappearing and shrinking in size, predators, like fish and birds, may have to consume larger quantities of smaller insects to meet their energy needs. Consuming more small insects can strain predators as they use additional energy to look for larger numbers of smaller prey. Less optimal food for these species can lead to decreased survival, further contorting the food web. 

In addition to changes within the stream corridor, light pollution brings many pressures to terrestrial insect communities. Bright lights are known to attract flying insects outside of streams – think of your porch light and all the insects that fly near it at night. This attracts more predators, such as bats, that feed on vulnerable species of insects near these lights. While some predators suffer because of light pollution, species like bats can benefit based on different behaviors in different areas. 

The map above shows the light pollution levels in Southeast PA. Philadelphia, a major city center, has incredibly high levels of light. Locally, West Chester, Marple, and Media all exert high levels of light pollution, as compared with the Trust’s program area, which experiences lower levels of light pollution thanks to lower development levels. These lower light levels can be attributed to protected lands. 

While avoiding light pollution is incredibly unlikely, there are solutions and actions we can take to minimize its effect on wildlife globally. At home, turning off bright outdoor lights or getting an automatic light can decrease light output. When choosing lights, picking lights that effectively target an area to be lit is important, as ineffective lights can cast a glow beyond the anticipated area and pollute more space than necessary. Within our communities, we can advocate for darker nights by telling our towns and cities to turn off unnecessary public lighting on buildings and in public spaces, much like Philadelphia did this last spring. As for protecting our waterways, planting and maintaining a healthy riparian buffer can go a long way in shielding waters from harmful light pollution. Thick plant growth will block incoming light and help keep our streams at lower light levels, ensuring aquatic insects, fish, and other riparian organisms can thrive. 

Citations:

Light pollution effects on wildlife and ecosystems. International Dark-Sky Association. (2016, September 12). https://www.darksky.org/light-pollution/wildlife/. 

Longcore, T., & Rich, C. (2004). Ecological light pollution. Frontiers in Ecology and the Environment, 2(4), 191-198.

Meyer, L. A., & Sullivan, S. M. P. (2013). Bright lights, big city: influences of ecological light pollution on reciprocal stream–riparian invertebrate fluxes. Ecological applications, 23(6), 1322-1330.

Header Image Eco Watch

Filed Under: Conservation, Education, Land Protection, Science, Watershed Tagged With: pollution

Microplastic Pollution is No Small Problem

June 30, 2021 By Zack Smith

By Zack Smith

Mankind’s mass production and consumption of plastic has reached all corners of our globe, from the depths of the oceans to the air around us. Plastic pollution comes in all shapes and sizes. Whether it is large chunks of styrofoam littering the side of the road or small fragments of broken down water bottles in our waters, plastic is constantly reaching new areas on our planet. 

One form of plastic pollution that has been getting increasing attention in the recent decades is microplastic pollution. Microplastics are pieces of plastic that are less than 5 millimeters in diameter. Surprisingly, some microplastics are produced at this size. These are called primary microplastics. Secondary microplastics occur when litter or other plastic refuse enters the environment and begins breaking into thousands of little pieces. The small size and widespread abundance of microplastics make them easily transportable in our world. Consequently, scientists have been finding plastics in almost every single spot they look for them — down to the organs of living beings. 

5 different types of microplastics seen in our headwaters.

While only discovered in our global waters and environments recently, microplastic pollution has been found in museum collection specimens dating back to the 1950s. This indicates that microplastics are persistent and likely have been causing harm to life on Earth for much longer than we realized. Plastics carry contaminants and pathogens and can cause harm to species by hindering their ability to properly function. Oceans, the atmosphere, and urban rivers have been the main focus of most microplastic research as they tend to accumulate in these environments because other outputs are constantly bringing microplastics to them. Despite being a global problem, very little has been done to document microplastic pollution in low order streams like the headwaters located  here in the Trust’s program area.

Over the past year, the Watershed Protection Team has been collecting and analyzing samples of stream water for microplastics to quantify the extent of any microplastic pollution in our area. Much to our surprise, microplastics are present in all of our headwaters at higher levels than anticipated. Dating back to March 2019, over 4,600 microplastics have been identified in roughly 200 liters of sample water.

Collection of microplastic sample using a glass jar

In 2021, our Watershed Protection Team has adjusted their sampling protocols to see how a plastic-free sampling method impacts the count. Before the Covid-19 pandemic, samples were collected using our typical monthly water sampling methods, which included storing water in plastic containers, using distilled water from plastic jugs, and storing dried samples in plastic bins. Clearly, when trying to quantify and describe a major pollutant you want that pollutant absent from all aspects of collection  — hence our new, plastic-free collection. The changes that we have made to our monitoring protocol have reduced the amount of plastic present in samples; we have yet to collect any field sample that is completely plastic free, which suggests that there is plastic in our waterways. 

A collection site at Kirkwood Preserve. Photo by Anna Willig

The hope is that this method will show truer values of the microplastics in our waterways and help us determine ways we may be able to further understand this pollutant. Our aim is to constantly monitor the health of our waterways so we can relieve any unwanted strain on our downstream neighbors. With microplastics present here in our headwaters, working to reduce their impact in rivers, bays, and oceans through small changes and constant monitoring at the source can go a long way.

Filed Under: Plastic Free July, Science, Watershed

Creek Week: Harmful Algae Blooms

June 25, 2021 By Watershed Protection Team

The arrival of warm weather means summer is coming and peak swimming season is right around the corner. However, when looking for spots to swim, always be mindful of looking at the Harmful Algal Bloom (HAB) index. HAB’s are when algae, blue-green cyanobacteria, densely grows in a body of water making it look green and smell foul. Not only does the water look odd, it actually becomes dangerous due to toxins that the algae secrete. This can cause issues to everything living in or around the contaminated water source, as the toxins are extremely fatal. In freshwater sources, HAB’s will most likely look green to a rusty orange while saltwater blooms can have a vibrant red coloration. There will also be a distinct “rotten” smell that comes from the water which comes from the constant decomposition of the algae and other living beings that have been affected by the blooms (CDC, 2021).

When an instance of HAB occurs in a waterway, there are many immediate concerns that arise for wildlife. The algae grows at the surface of water, which blocks light from reaching the floor where most aquatic plants live and rely on light to make energy. When aquatic plants die, many of the species that use them for food and shelter are negatively impacted and may struggle to survive. Aquatic plants are a large source of oxygen in water, so when HAB’s photosynthesize at the surface, not only do they kill species that add oxygen, but they also use the already lowered supply themselves, which creates a cycle of losing vital oxygen. In addition, the algae itself produces toxins that are fatal to many aquatic species, killing them within days of exposure. These processes all occur simultaneously and are referred to as eutrophication, a surplus of nutrients that leads to overgrowth of plant life and death of animal life (Oxford Languages, 2020).

While these effects of HABs may seem disconnected from human life, the exact opposite is the case. Swimming in water contaminated by HAB’s can have immense health effects on people of all ages, and can even be deadly. Direct exposure to blooms may cause a rash, stomach illness, respiratory illness or neurological effects (EPA, 2019). In young children, ingestion can lead to poisoning that requires immediate medical attention. A commonly overlooked aspect of the effects of HABs are their impact on dogs and pets. Before allowing a dog to drink from a waterway, be sure to check for the telltale signs of HABs, as a dog can be poisoned and die within a matter of hours. The signs of algal poisoning in dogs are: lethargy, panting, diarrhea, seizures, vomiting or respiratory failure (ASPCA, 2019). Also be aware of rinsing your dog’s fur after contact with contaminated water as the toxins can stick to fur and they may be poisoned from grooming themselves. Although there are dangerous impacts to human health, there is little prevention that can be done to protect waterways.  The exact root cause of HABs is not known, so the best way to protect yourself is to be knowledgeable on the signs of contaminated water. The best supported theories about the causes of HAB’s show that warm, still moving water seems to be the most ideal growing conditions for dense algal blooms (NOAA, 2017). A surge of nutrients, such as lawn or agricultural fertilizer runoff, can also cause a large bloom to occur. When it comes to HAB’s, the best course of action is to recognize the signs of contamination and simply avoid contact with the water.

By Gloria Avila

Sites that track HAB’s that may be of use this summer:

Lake Champlain: https://ahs-vt.maps.arcgis.com/apps/webappviewer/index.html?id=a46d42c05e864a198ab5dc152f9d09b9

Chesapeake Bay: http://eyesonthebay.dnr.maryland.gov/eyesonthebay/habs.cfm

Lake Erie: https://tidesandcurrents.noaa.gov/hab/lakeerie.html

Florida: https://floridadep.gov/AlgalBloom

Resources:

Centers for Disease Control and Prevention. (2021, April 19). Protect Yourself and Your Pets. Centers for Disease Control and Prevention. https://www.cdc.gov/habs/prevention-control.html.

ASPCA. (n.d.). Pet Safety Alert: The Rising Dangers of Blue-Green Algae. ASPCA. https://www.aspca.org/news/pet-safety-alert-rising-dangers-blue-green-algae#:~:text=Dogs%20can%20develop%20poisoning%20when,Seizures.

US Department of Commerce, N. O. and A. A. (2014, August 1). Why do harmful algal blooms occur? NOAA’s National Ocean Service. https://oceanservice.noaa.gov/facts/why_habs.html.

Filed Under: Nature, Science

  • « Previous Page
  • 1
  • 2
  • 3
  • 4
  • 5
  • Next Page »

CONTACT

925 Providence Road
Newtown Square, PA 19073
(610) 353-2562
land@wctrust.org

JOIN OUR MAILING LIST

Copyright © 2025 · WCTRUST.ORG