WILLISTOWN CONSERVATION TRUST

  • Facebook
  • Instagram
  • LinkedIn
  • YouTube
DONATE
  • About
    • HOW WE WORK
    • WHERE WE WORK
    • OUR STAFF AND TRUSTEES
    • JOBS & INTERNSHIPS
    • VOLUNTEER
    • RUSHTON CONSERVATION CENTER
    • STRATEGIC PLAN
    • DIVERSITY, EQUITY & INCLUSION STATEMENT
    • FAQs
  • LATEST
    • BLOG
    • IN THE NEWS
    • PUBLICATIONS
    • PHOTOS
  • PROGRAMS
    • BIRD CONSERVATION
    • COMMUNITY FARM
    • EDUCATION
    • LAND PROTECTION
    • STEWARDSHIP
    • WATERSHED PROTECTION
  • NATURE PRESERVES
    • ASHBRIDGE PRESERVE
    • HARTMAN MEADOW
    • KESTREL HILL PRESERVE
    • KIRKWOOD PRESERVE
    • RUSHTON WOODS PRESERVE
  • EVENTS
    • EVENT CALENDAR
    • BARNS & BBQ
    • RUN-A-MUCK
    • WILDFLOWER WEEK
    • ECOCENTRIC EXPERIENCE
    • RUSHTON NATURE KEEPERS (RNK)
    • ACCESS Program
  • Support
    • WAYS TO GIVE
    • SPONSOR THE TRUST
    • CORPORATE PARTNERSHIP PROGRAM
    • JOIN THE SYCAMORE SOCIETY
    • LEGACY SOCIETY & PLANNED GIVING
    • DELCO Gives 2025
  • CAMPAIGN FOR KESTREL HILL PRESERVE

State of Our Streams Report Chapter 1: Introduction and Basic Stream Parameters

August 3, 2022 By Watershed Protection Team

By Anna Willig and Lauren McGrath | Willistown Conservation Trust Watershed Protection Program

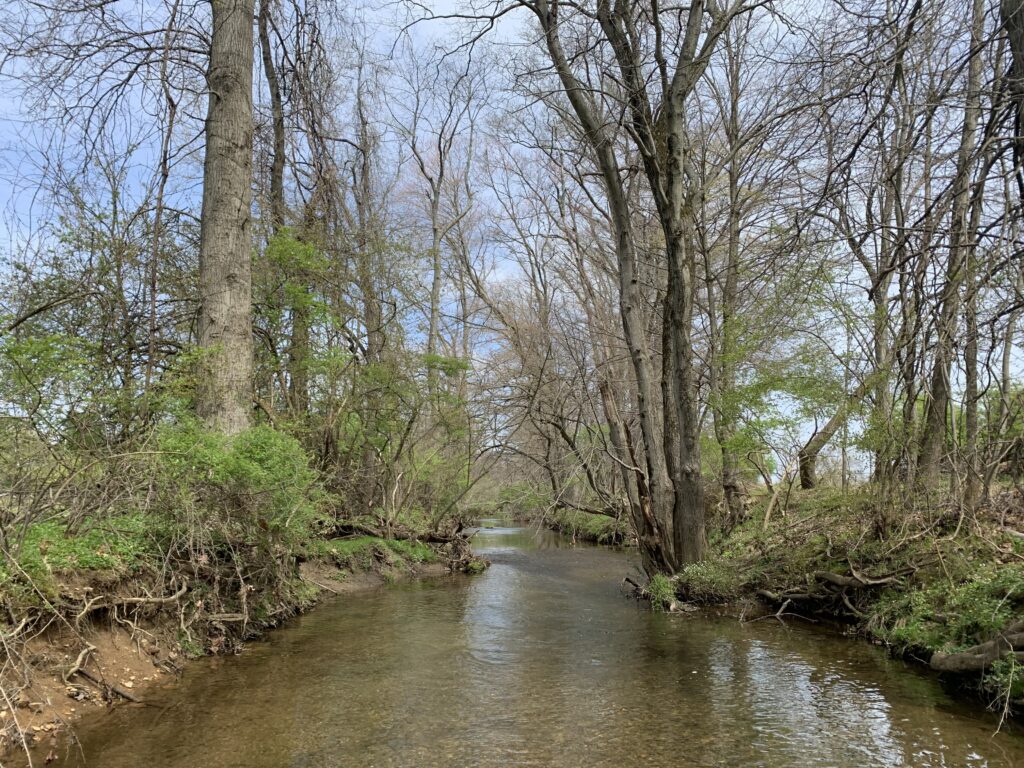
Cover Photo by Jennifer Mathes

The focus area of Willistown Conservation Trust  (WCT) includes over 190 miles of headwater streams in the Darby Creek, Crum Creek, and Ridley Creek watersheds, which are all tributaries to the Delaware River. Everything that happens in the headwaters of a stream impacts the rest of the system, meaning that any action taken in the WCT focus area has consequences for water quality that extend far beyond our region. 

The Watershed Protection Program was established in 2017 through a generous grant from William Penn Foundation and a strong partnership with the Academy of Natural Sciences of Drexel University. The Watershed Protection Program is part of the Delaware River Watershed Initiative (DRWI), which was established to study existing water conditions within the Delaware River basin and to coordinate efforts, around both data collection and analysis, to develop best management practices for land use that can help improve water quality. With the support of the Academy of Natural Sciences of Drexel University and Stroud Water Research Center, WCT Watershed Protection staff implemented a water quality monitoring program to understand how WCT’s conservation efforts have impacted local stream health. 

Since 2018, the Watershed Protection Program has monitored water quality at ten sample sites in the headwaters of Darby, Crum, and Ridley Creeks (Figure 1). Every four weeks, the team visited each of the ten sites to take in-stream measurements and collect samples for analysis in the lab. We are proud to present our findings on water quality based on analysis of our data collected from 2018 through 2021, which includes 41 monitoring visits and over 7,500 different measurements. 

August is National Water Quality month, and each week we will publish excerpts from one chapter of our report. The full report, which includes more information than is provided in the blog posts, will be released at the end of the month. This week, we are focusing on three parameters that make up the backbone of water quality monitoring: water temperature, dissolved oxygen, and pH.

The full report, which includes more information than is provided in the blog posts, can be found here.

_____________________________________________

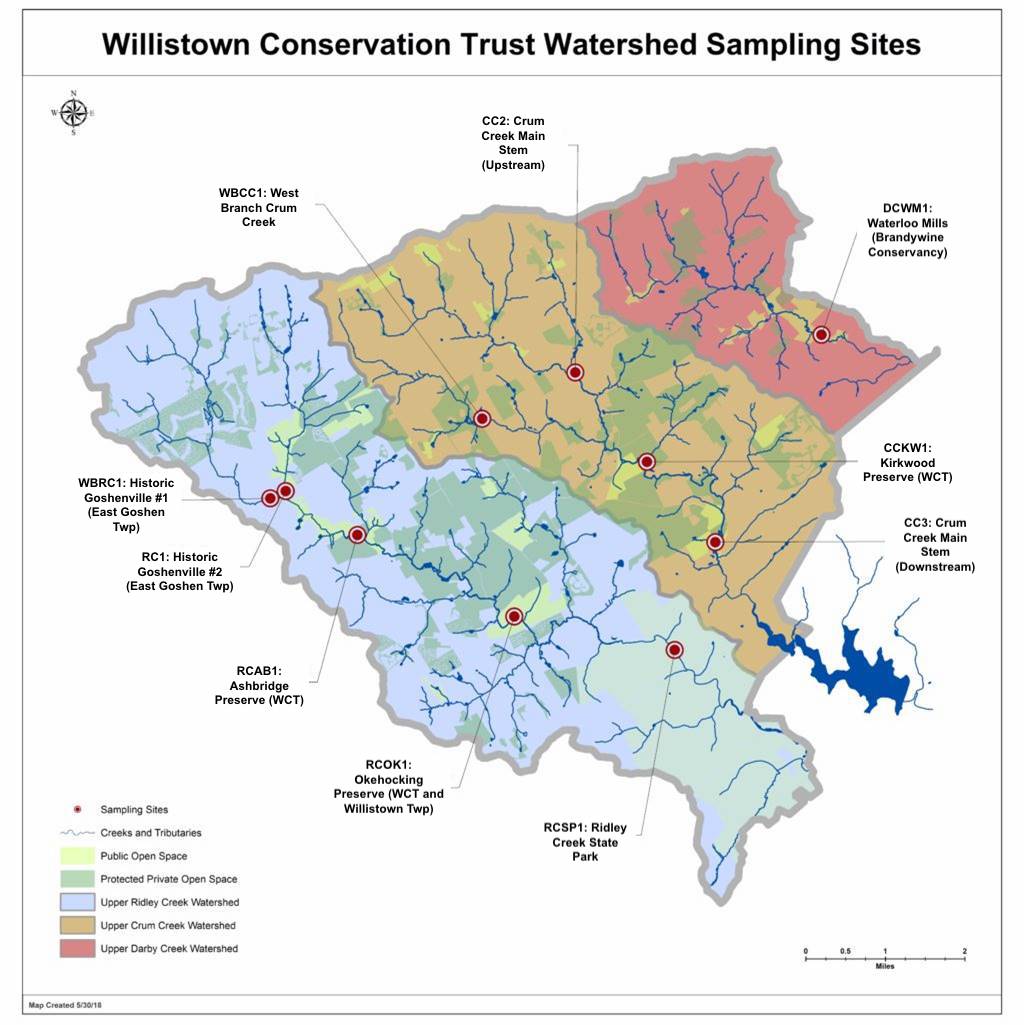
Figure 1. Willistown Conservation Trust’s water chemistry sampling sites. Five sample locations are within the Ridley Creek watershed, four are within the Crum Creek Watershed, and one is within the Darby Creek Watershed. Sampling was conducted at each site every four weeks from January 2018 through December 2021.

In the headwater streams studied for this report, water temperature is driven by air temperature, causing strong seasonal variation, with near-freezing temperatures in the winter and high temperatures in the summer. Water temperature is also linked to land use. The removal of trees along streams exposes streams to direct sunlight, warming the water. Additionally, parking lots, roads, and sidewalks all absorb heat in the summer and warm up rainfall before it enters streams, further raising water temperatures. Elevated water temperature is of concern due to its relationship with dissolved oxygen in streams. In waterways, dissolved oxygen represents the amount of oxygen available for use by aquatic organisms. As temperature increases, water can hold less dissolved oxygen, meaning there may not be enough for all organisms living in the stream.  

Another key benchmark for stream health is pH, which measures how acidic or basic the water is. If water is too acidic or basic, it becomes toxic for many aquatic organisms, even if water temperature is not too high and there is enough dissolved oxygen. Thus, measuring water temperature, dissolved oxygen, and pH can quickly reveal how hospitable streams are for aquatic life.

Results from analysis of our data indicate that water temperature is an impairment at our sample sites. Temperature is elevated at all sample sites, especially during summer months, stressing sensitive aquatic organisms such as trout and freshwater mussels. Dissolved oxygen does not drop below levels deemed unsafe for aquatic life, but it is not high enough during summer months to support the reproduction of trout populations. pH remains within the range deemed safe for aquatic life, though it can approach dangerous levels at some sites. 

For a primer on statistical tests and how to read boxplots and scatterplots, click here.

Water Temperature

Figure 2. Water temperature from January 2018 through December 2021 (a) across ten sample sites in the headwaters of the Darby, Crum, and Ridley Creeks and (b) over time. The lines represent maximum allowable temperatures for a Cold Water Fishery (CWF), Trout Stocked Fishery (TSF), and Warm Water Fishery (WWF). 

Water temperature is the primary parameter by which the Pennsylvania Department of Environmental Protection designates protected uses for streams. Water temperature is closely linked to the amount of dissolved oxygen in the water and, consequently, different species can tolerate different temperatures. The three protected uses that have temperature criteria are Cold Water Fisheries, Warm Water Fisheries and Trout Stocked Fisheries. A Cold Water Fishery supports the survival and reproduction of Salmonidae fish species (including Brook Trout, Salvelinus fontinalis) and other aquatic flora and fauna that require a cold water habitat, while a Warm Water Fishery supports the survival of fish and aquatic flora and fauna that can tolerate a warmer habitat.1 A Trout Stocked Fishery supports the survival of stocked trout from February 15 to July 31 in addition to all the species supported by a Warm Water Fishery.1

There are no significant differences in water temperature between sample sites (Figure 2a). Water temperatures are regularly above Cold Water Fishery maximums at all sample sites throughout the year. In winter and spring months, water temperatures can exceed Warm Water Fishery and Trout Stocked Fishery maximums during unseasonably warm days. During summer months, water temperatures are consistently below Warm Water Fishery maximums but occasionally exceed Trout Stocked Fishery maximums during heat waves. The frequency with which temperature exceeds Cold Water Fishery requirements and the occasional exceedance of Warm Water Fishery and Trout Stocked Fishery maximums signifies that all sites are impaired by elevated temperature (Figure 2b). This stresses sensitive organisms such as Brook Trout, freshwater mussels, and stream insects like mayflies, stoneflies, and caddisflies.

Dissolved Oxygen

Figure 3. Dissolved oxygen content from January 2018 through December 2021 (a) across ten sample sites in the headwaters of the Darby, Crum, and Ridley Creeks and (b) over time.

All living animals require oxygen to breathe, and stream-dwelling organisms like fish and aquatic insects are no exception. Dissolved oxygen is temperature dependent. Cold water can hold a higher concentration of dissolved oxygen than warm water; consequently, dissolved oxygen is highest in the winter and lowest in the summer (Figure 3b). Dissolved oxygen is also related to photosynthesis. As aquatic primary producers, or plants and algae, photosynthesize during the day, they increase the amount of dissolved oxygen in the water. Conversely, as these producers cease photosynthesis at night, they consume oxygen through respiration, decreasing the amount of dissolved oxygen in the water. As a result, dissolved oxygen follows a daily cycle, rising during the day and falling during the night.2

The amount of dissolved oxygen in the water impacts the reproduction and survival of many species. If dissolved oxygen drops below a certain level, aquatic organisms will be too stressed to reproduce. If it drops further, these organisms may suffocate and die. The dissolved oxygen standard for a Cold Water Fishery, according to the Pennsylvania Department of Environmental Protection, depends on the presence or absence of naturally reproducing fish in the Salmonidae family, which includes all trout species. To the best of our understanding, none of the sampled streams have naturally reproducing salmonids, so the dissolved oxygen standards for a Cold Water Fishery are at least 6.0 mg/L over a 7-day average with a minimum of 5.0 mg/L at any given time.3 Dissolved oxygen has not dropped below 7.0 mg/L at any sample sites, but all measurements were taken during daylight hours and do not capture nighttime dissolved oxygen minimums. Consequently, it is unclear whether dissolved oxygen is within the range of a Cold Water Fishery at the sample sites. 

There are significant differences in dissolved oxygen between sites, with significantly higher dissolved oxygen  at Ridley Creek at Okehocking Preserve (RCOK1) than at Crum Creek Main Stem Upstream (CC2) and Darby Creek at Waterloo Mills (DCWM1) (Figure 3a). This difference is likely due to sampling time: RCOK1 is sampled in the afternoon, when photosynthesis is highest and dissolved oxygen peaks, while CC2 and DCWM1 are sampled in the morning, when there is less photosynthesis and dissolved oxygen is consequently lower. However, Ridley Creek State Park (RCSP1) and Crum Creek Main Stem Downstream (CC3) are also sampled in the afternoon and are not significantly higher than DCWM1 and CC2, suggesting that other factors, in addition to photosynthesis, may explain the differences in dissolved oxygen at these sites.

pH

Figure 4. Stream pH from January 2018 through December 2021 (a) across ten sample sites in the headwaters of the Darby, Crum, and Ridley Creeks and (b) over time.

Another important water quality parameter is pH, which measures how acidic or basic water is. A pH of 7.0 is neutral, a pH below 7.0 is acidic, and a pH above 7.0 is basic. pH determines how easily an aquatic organism can use nutrients and indicates how toxic pollutants may be. To qualify as a protected fishery by the Pennsylvania Department of Environmental Protection, a stream must have a pH between 6.0 and 9.0.3 When pH is outside this range, nutrients become difficult to absorb and pollutants become more toxic, stressing organisms and leading to a reduction in biodiversity. Stream pH is influenced by in-stream photosynthesis, local soil type, geology, and human-based pollution. 

The pH of each stream in the study area tends to be slightly basic. No sites have pH measurements outside the 6.0 – 9.0 range designated by Pennsylvania Department of Environmental Protection as a protected fishery, though RCOK1 and RCSP1 reach over 8.9.3 pH does not exhibit strong seasonal variation (Figure 4b). 

There are significant differences in pH between sites. pH is significantly higher at RCOK1 than at all other sample sites and is also elevated at CC3 and RCSP1 (Figure 4a). Some variation in pH between sites could be explained by the sampling time. Photosynthesis increases the pH of streams by removing carbon dioxide. Photosynthesis peaks in the afternoon and, consequently, pH tends to be higher in the afternoon. RCOK1, RCSP1, and CC3 are always sampled in the afternoon, therefore, photosynthesis likely explains the elevated pH at these sites. 

Key Takeaways

  • Water temperature is a significant impairment at all sample sites and any effort to restore Darby, Crum, and Ridley Creeks must aim to reduce water temperatures.
  • There is generally enough dissolved oxygen to support the survival of aquatic organisms, though it may be low enough in the summer to stress and limit the reproduction of sensitive groups.
  • pH is within a safe range at all sample sites, though it can approach unsafe levels at RCOK1 and RCSP1. 
  • The best way to address water temperature impairments is to plant native trees and shrubs along waterways. Click here for more information on the role of riparian plants, and check out these resources from WCT’s Stewardship Team to learn more about the best native plants to plant in these areas.

To read the full “State of our Streams Report,” click here.

Funding 

This report was made possible through a grant from the William Penn Foundation. The William Penn Foundation, founded in 1945 by Otto and Phoebe Haas, is dedicated to improving the quality of life in the Greater Philadelphia region through efforts that increase educational opportunities for children from low-income families, ensure a sustainable environment, foster creativity that enhances civic life, and advance philanthropy in the Philadelphia region. In 2021, the Foundation will grant more than $117 million to support vital efforts in the region. 

The opinions expressed in this report are those of the author(s) and do not necessarily reflect the views of the William Penn Foundation. 

References

1. Pennsylvania Department of Environmental Protection. 25 Pa. Code Chapter 93. Water Quality Standards § 93.3. Protected water uses. http://www.pacodeandbulletin.gov/Display/pacode?file=/secure/pacode/data/025/chapter93/chap93toc.html&d=reduce (2009).

2. Wilson, P. C. Dissolved Oxygen. 9 https://edis.ifas.ufl.edu/publication/SS525 (2019).

3. Pennsylvania Department of Environmental Protection. 25 Pa. Code Chapter 93. Water Quality Standards § 93.7. Specific Water Quality Criteria. http://www.pacodeandbulletin.gov/Display/pacode?file=/secure/pacode/data/025/chapter93/chap93toc.html&d=reduce (2020).

4. Kellner, E. & Hubbart, J. A. Advancing Understanding of the Surface Water Quality Regime of Contemporary Mixed-Land-Use Watersheds: An Application of the Experimental Watershed Method. Hydrology 4, 31 (2017).

5. Mealy, R. & Bowman, G. Importance of General Chemistry Relationships in Water Treatment. (2004).6. Mesner, N. & Geiger, J. pH. (2005).

— By Anna Willig and Lauren McGrath | Willistown Conservation Trust Watershed Protection Program

Filed Under: Science, Watershed

Project Plastic and the Hunt for Microplastics

July 27, 2022 By Watershed Protection Team

By Amy Amatya of Project Plastic

Some of the greatest challenges humanity faces today — pandemics, climate change, water contamination — are invisible. They escalate because we don’t see them coming, or we ignore the data that help us see them. 

Microplastics are no exception. Defined as any plastic smaller than five millimeters in diameter, microplastics pose a big problem to the environment and ourselves. They are easily ingested, potentially toxic, and everywhere. In fact, microplastics are found in nearly every corner of the world, right down to the tissues of living organisms. 

Microplastics exist via two pathways: they are mass-produced to be this size (‘primary’), or they come from the degradation of larger plastics (‘secondary’). Primary microplastics are difficult to target because production is controlled by industries including textiles, cosmetics, and household items. Considerable persuasion of regulators and corporations is necessary to reduce microplastic production. Some progress has been made on this front, as the Microbead-Free Waters Act of 2015 prohibits microplastic use in wash-off cosmetics. However, secondary microplastics are difficult to target because a lot of plastic already exists in the world. The sheer difference in scale between microplastics and the landscapes they inhabit prohibit remediation. Even if we ceased all plastic production today, there are still 200 million tons of plastic circulating in our oceans.

Despite their huge threat, there are no consistent protocols available for the accurate and 

systematic recording of microplastic pollutant concentrations in water. There is also no existing technology available to sequester all microplastics from tributaries, effluent streams, reservoirs and lakes. There are three approaches to reducing microplastic pollution. We can: 

1) Produce less plastic, 

2) Prevent existing plastic from entering the environment, and 

3) Remove microplastics directly from the environment. 

The Project Plastic meets with the ACUA Wastewater Treatment Facility about the future of Plastic Hunters in wastewater management systems. Photo by Project Plastic

Project Plastic was moved by the third approach to develop the world’s first portable, affordable, and environmentally friendly microplastic measuring and sequestration device. Project Plastic is a team of chemists and architectural designers, but we aren’t just a filtration technology company. Driven foremost by the microplastic problem, we follow microplastics to the end of their aquatic lifetime. We strive to collaborate with riverkeepers, water treatment companies, and private bottled water companies to monitor, collect, and upcycle microplastic pollution from waterways. 

Our device utilizes a patented ‘artificial root’ technology that acts as a filter to remove small debris (including microplastics) from the upper water column, where most plastic pollutants accumulate. Our root technology is modeled after organic aquatic plant roots. Long fibrous filaments are suspended in water and sediments physically adhere to the dense fibers on each root. Naturally-occurring biofilms accumulate on the ‘artificial root’ network over time, which further traps small particles. By applying an array of ‘artificial roots’ to the underside of a flotational frame, our device can entrap large quantities of microplastics while allowing aquatic wildlife to swim below or between our filter. Each biofilter is attached to a removable pad, making it easy to swap biofilters once they become saturated. Each pad is housed within a hydrodynamic flotation frame for application in rivers, streams, and reservoirs.

The Plastic Hunter: a portable, affordable microplastic filter inspired by plant roots. Image created by Project Plastic

The Plastic Hunter has a key advantage over conventional filtration technologies: it has no mechanical components, meaning it can operate passively with no electricity and minimal maintenance. This makes the device far cheaper to produce, deploy and maintain compared to any existing microplastic filtration system.

Lastly, our team is currently working on establishing protocols for the separation and purification of contaminated sediments from our filter media. In doing so, our team hopes to extract relatively pure microplastic sediments from our devices to be forwarded to our research collaborators at the University of Washington in St Louis. The aim is to develop a method of converting microplastics into chemical compounds like carotene. If successful, our team may be able to upcycle microplastics into useful chemicals for other industries like pharmaceuticals, turning harmful waste into sustainable resources. This, we hope, will avoid environmentally harmful storage or processing of contaminated sediment through incineration, and instead propagate a circular economy for microplastic waste.

— By Amy Amatya of Project Plastic

Filed Under: Nature, Science, Watershed

The Tale of Two Streams

June 25, 2022 By Anna Willig

Every four weeks, the Watershed Protection Program heads over to East Goshen to visit two branches of Ridley Creek near the Goshenville Blacksmith Shop. We trudge down the road to our first site, RC1, which lies in the main stem of Ridley Creek. We hop in the creek, take measurements, collect samples, and then we walk about 150 feet to our next site, WBRC1, West Branch Ridley Creek, where we do it all over again. Even though these two sample sites are right next to each other, WBRC1 is in a completely different creek. Just downstream from these two sample sites, the West Branch merges into Ridley Creek, and the waters from the sample sites flow together as one.

Ridley Creek

In many ways, these two streams are identical. The amount of water flowing through them is nearly the same. Also similar in size is the size of land they drain. Their banks are lined by both trees and shrubs, with a few patches of clearing. The stream beds are rocky along with some sand and mud near the banks. Given all of these similarities, it would be easy to imagine that the water quality is similar at these two sites, as well.

image preview
West Branch Ridley Creek

However, as the Watershed Protection Team discovered, once we started looking at the water chemistry, we found that the two streams are quite different. Immediately, we noticed differences in specific conductivity. Specific conductivity measures the ease at which electricity can move through water, and pure water is a terrible conductor, meaning it has low specific conductivity. So when we find that specific conductivity is high in water, then that tells us that there are pollutants present. Comparing WBRC1 and RC1, we found that the specific conductivity is much higher in WBRC1 than RC1, meaning the water quality is much lower in WBRC1. However, specific conductivity cannot tell us which pollutants are in the water–it can only indicate that there are pollutants.  

Specific Conductivity Data for RC1 and WBRC1

Looking deeper into the chemistry, we found that WBRC1 contains higher concentrations of chlorides, nitrogen, and phosphorus, all of which increase specific conductivity. So where are they coming from? For chlorides, the answer is road salts. After road salts are applied in winter, they runoff into streams and groundwaters, where they can persist throughout the year, leading to higher concentrations of chlorides year round. For nitrogen and phosphorus, the answer is a little more complicated. They can come from a few different sources, most commonly fertilizers, leaky septic and sewer systems, and animal waste. Elevated concentrations of chlorides, nitrogen, and phosphorus are concerning because these pollutants can threaten the survival of sensitive stream organisms, such as mussels, trout, and stream insects. 

RC1 and WBRC1 Chloride Data

However, this poses more questions: why are there higher concentrations of salts and nutrients at WBRC1? How could water chemistry at two sites only 150 feet apart from each other be so different? To understand where these contaminants are coming from, we needed to look at what is going on in the land upstream of each sample site. And what we found is a difference in impervious surfaces.

Phosphorus Bar Graph
Nitrogen Bar Graph

Impervious surfaces are any surfaces that water cannot directly pass through, such as roads, sidewalks, parking lots, driveways, and buildings. These surfaces have several direct and indirect impacts on water quality. Many impervious surfaces are treated with road salt in the winter, and any rain or snow that hits these surfaces will carry that salt into the stream, increasing chloride concentrations. Impervious surfaces also reflect human activity in an area. Generally, the more impervious surfaces in an area, the more humans, and with more humans comes more fertilizer applications on lawns and gardens and more septic and sewer systems, all of which can flow into streams. As a result, there is a strong relationship between the amount of impervious surface cover and the pollutants that drain into a stream system.

We found that of the land that drains into WBRC1, 20% of that area is covered by impervious surfaces, as compared with RC1, where only 14% of the area is covered by impervious surfaces. While 6% may seem like a small difference, it is large enough to account for the difference in water quality of these two streams. This tells us that for Ridley Creek to maintain its health and water quality, we need to strive to stay below 20% impervious surfaces, and maybe even less than that. 

image preview
Catchments draining into West Branch Ridley Creek (WBRC1) and main stem Ridley Creek (RC1) sampling sites. Note the dense impervious surface cover in the WBRC1 catchment compared to the RC1 catchment.

The story of these two streams can be a hopeful one, and there are many lessons to be learned. If we can keep the amount of impervious surfaces down, we can protect water quality, even at an incredibly local scale. The more land we can protect as open space, the better the water quality in our streams and rivers. 

In addition to protecting land, we as individuals can also reduce the impact that impervious surfaces have on streams by doing the following:

  1. Limiting the amount of road salt used in the winter or sweeping up road salt after storms pass. This is a great way to reduce the amount of salt entering streams. 
  2. Reducing fertilizer use and avoiding applying fertilizers before rainstorms.
  3. Planting rain gardens alongside roads and driveways to help collect and filter stormwater, further reducing the amount of salts and nutrients entering streams. Native flowers, shrubs, and trees are great at absorbing excess nutrients and salts before they enter streams, and planting more of these plants will go a long way towards improving water quality.  
  4. Finding more tips here: Healthy Streams Start with Healthy Landscapes.

No matter how far away you are from a stream, any action you can take will make a difference.  

— By Watershed Conservation Associate Anna Willig

Sources:

Baker, M. E., Schley, M. L., & Sexton, J. O. (2019). Impacts of Expanding Impervious Surface on Specific Conductance in Urbanizing Streams. Water Resources Research, 55(8), 6482–6498. https://doi.org/10.1029/2019WR025014

Morse, C. C., Huryn, A. D., & Cronan, C. (2003). Impervious Surface Area as a Predictor of the Effects of Urbanization on Stream Insect Communities in Maine, U.S.A. Environmental Monitoring and Assessment, 89(1), 95–127. https://doi.org/10.1023/A:1025821622411

Filed Under: Nature, Science, Watershed

The Trust Teams up with Project Plastic at Ashbridge Preserve to Clean Up Microplastics Using Innovative Device: The Plastic Hunter

February 1, 2022 By CommIntern

Last year we learned that Microplastic Pollution is No Small Problem, after our Watershed Protection Program discovered the dangerous presence of these minute plastics within the headwaters of our focus area: Crum, Darby and Ridley Creeks. Our Watershed Team continues to document and monitor their presence, but now with the help of Project Plastic.

Based in Princeton, New Jersey, Project Plastic is made up of Princeton students and postdoctoral researchers working to design, develop and implement natural systems that can be used to remove plastic pollutants from rivers. Founder Yidian Liu was inspired to find a solution to plastic pollution after observing an increase in the presence of plastics and microplastics gathering in the waterways following large storms in her hometown in China. Now, with Project Plastic, it is her goal to create the first portable microplastic collection device that is both easily portable and environmentally friendly.

Enter the “Plastic Hunter,” an “affordable floating wetland unit that collects and removes microplastic debris from rivers via plant root biofilters.” Resembling an elongated hexagon, this device consists of a fiberglass frame that holds a net-like pad that is both compostable and consisting of a planting membrane. This is where the magic happens – once deployed on the surface of a polluted river, the plant membrane grows downward, and over time, its dangling roots catch microplastic fragments. Once saturated, the removable planting membrane is carefully lifted from the water with a net, and the contaminated plant matter can be taken back to the lab for analysis. A new pad replaces the old one, and the microplastic-trapping cycle continues.

  • Plastic Hunter’s natural fibers and root system catch microplastics
  • Removing Plastic Hunter
  • A Root Sample Retrieved for Analysis

Conceived and developed by Yidian Liu and Nathaniel Banks, this device and Project Plastic have already received attention after winning multiple awards, including a $10,000 prize for top startup at the Princeton Startup Bootcamp.  They have since added to their team, refined their idea, filed a patent, and made multiple design improvements using 3D print prototypes. And then this past December and January, Project Plastic officially launched the very first Project Hunter prototype at Ashbridge Preserve with the help of our Watershed Protection Team.

Thanks to the continual monitoring of our watersheds, Watershed Protection Program Director Lauren McGrath identified a test site known to be highly contaminated with microplastics at Ashbridge Preserve. Plastic Hunter lived here for one month, where it was anchored to stakes located on either side of the stream, covering the majority of the stream’s width. And in place of a true plant membrane, an artificial root system comprised of coconut fiber brushes was used to entrap microplastics, essentially acting as a filtration device.

  • Project Plastic and WCT at Ashbridge Preserve
  • Plastic Hunter Up and Running at Ashbridge Preserve

Throughout Plastic Hunter’s stay at Ashbridge, Lauren McGrath and Watershed Conservation Associate Anna Willig collected water samples around Plastic Hunter on a weekly basis to determine if the device had reduced microplastic quantities within the stream. Once Plastic Hunter was removed from the stream, its fibers were taken by to Project Plastic’s lab for analysis, and there, the team found that their prototype was mostly effective in capturing microplastics.

  • Water Samples for Analysis
  • Processing of the Water Samples
  • Microplastic Fiber Identified under a Microscope

Says Yidian Liu, “The Ashbridge Preserve field test marks a prospective start to the development and continued refinement of the Plastic Hunter, as well as an auspicious confirmation of the device’s technical feasibility and efficacy. We are looking forward to continuing to improve this device with the help of the Trust’s Watershed Team.” The group hopes to make Plastic Hunter more buoyant with increased connectivity between those fibers and the device’s frame.

The vision for this group is to deploy future generations of Plastic Hunter across rivers, ponds, and other bodies of water, where their hexagonal frames can connect to one another to create larger filtration devices. Yidian and Nathaniel aim to keep costs as low as possible, so that their product can be affordable and reach a variety of customers across the world. And by focusing on using compostable, natural materials, they hope to also reduce the cost to our planet.

Says the Trust’s Watershed Protection Program Director Lauren McGrath, “Globally, microplastic contamination is a major concern for public and environmental health, and identifying meaningful solutions for the reduction and removal of plastic from stream and ocean systems has been a serious challenge. We have enjoyed partnering with the Project Plastic Team and are inspired by their creative and innovative approach to this increasingly complex issue. We hope that through regular monitoring and creative problem solving, we can continue to better understand how to reduce microplastic pollution in our waterways.”

Visit Project Plastic to learn more about their plastic-free vision for the future!

Filed Under: Science, Watershed

Beaver Business

January 4, 2022 By Anna Willig

Please Note: The Watershed Protection Team is excited to welcome our newest team member and encourages all visitors to keep an eye out for beavers at Ashbridge but please do not go searching for them. The health of our waterways will benefit from the presence of Castor canadensis, so please be respectful of their space.  

In the middle of the 2021 spring tree planting, the Watershed Protection Team had quite the surprise when we spotted evidence of beaver activity in Ashbridge Preserve. A single tree was knocked down along Ridley Creek, with distinctive teeth marks that indicated a beaver had found itself a tasty meal. In October, the first lodge was located, and it was clear that the beavers had settled in the center of 1,000 freshly planted trees. But more than concern was a feeling of validation; the hard work of every staff member, volunteer and student has resulted in the creation of suitable habitat for one of nature’s most effective ecosystem engineers.

  • A beaver caught on the Trust’s wildlife cam
  • Evidence of beaver activity at Ashbridge Preserve. Photo by author.

Beavers (Castor canadensis) are the largest rodent found in North America, reaching 3 feet in length and weighing between 30 and 60 pounds. They have small faces, stocky brown bodies, and a distinctively hairless, paddle-shaped tail. Their tail allows beavers to be distinguished from groundhogs, which have short, furry tails, and muskrats, which have long, hairless tails. Beavers are well-adapted for an aquatic lifestyle: when they dive underwater, their eyes are protected by a set of transparent eyelids and their ears and nose are protected by watertight membranes. They even have a second set of lips that close behind their teeth, which allows them to chew while underwater and not drown. They can remain underwater for 15 minutes, and their oily, waterproof fur helps them stay dry. Their webbed feet and rudder-like tail allows beavers to swim at speeds of 5 miles per hour.

Chompy the beaver was donated to Willistown Conservation Trust and currently lodges in the Rushton Conservation Center. Note its glossy fur and hairless, paddle-shaped tail. Photo by author.

Beavers were once abundant throughout North America, from northern Mexico all the way up to the southern Arctic. However, they were heavily hunted for their waterproof pelts by European colonizers, and their numbers dropped rapidly. In Pennsylvania, beavers were wiped out by the beginning of the 20th century. Reintroduction efforts in the 1920s proved successful, and beaver populations have been stable in Pennsylvania since the 1930s, though they likely are not as abundant as they were before European colonization. There are a few known beaver colonies near Willistown in Ridley and Darby creeks, and evidence of beaver activity is occasionally spotted in Willistown, most recently at Ashbridge Preserve.

Beavers are perhaps nature’s most effective engineers, changing entire ecosystems to fit their needs. They build their homes, called lodges, almost exclusively in the middle of slow-moving ponds, where the surrounding water acts as a moat that protects them from terrestrial predators. If no such pond can be found, beavers dam streams and rivers to create the perfect pond. To create their dams, beavers cut down trees with their chisel-like teeth, which constantly grow and self-sharpen. They generally prefer trees with diameters of less than 3 inches, but will cut down larger trees if small trees are not readily available. They construct their dam with logs, branches, twigs, and grasses and seal everything into place with mud. 

Once the dam backs up enough water, beavers build wood and mud lodges in the middle of the pond that can be 6 feet high and up to 40 feet wide. These lodges have 1 or 2 underwater entrances, a ‘living area’ above the water line, and a small air hole in the top to provide ventilation. A lodge houses a colony made of a breeding pair — believed to mate for life — the current years’ kits, and the surviving offspring from the year before. Before the kits are born, the female drives out the second year young. After the young are driven out from the den, they disperse to find new habitat and form their own colonies. 

Beaver settlement causes widespread changes to an ecosystem. The first noticeable change is the clearing of several trees, usually small, that the beaver will use to build its dam. After the dam is built, the creek will start to back up, flooding the adjacent land and forming a small pond. More trees may be felled to build the beaver’s lodge. What was once a wooded valley with a small stream becomes an open pond bordered by wetland vegetation. This new pond supports a host of wetland species that would not otherwise be found in the area — ducks, geese, herons, turtles, fish, frogs, salamanders, and more. Even beaver lodges create habitat: the underwater base of the lodge provides shelter for young fish and the top of the lodge can be a nesting area for birds. 

A beaver captured on the Trust’s game cam

Beyond supporting a biodiverse ecosystem, beavers and their dams improve local water quality. Beaver ponds trap and slow down water, reducing downstream flooding during major storm events. By slowing down the flow of water, beaver dams also allow more water to seep through the soil and replenish groundwater resources. As water passes through a beaver pond, fine sediment and pollutants are filtered out, resulting in cleaner water downstream of the dam. 

Beavers inhabitat a pond until they deplete all nearby food sources, usually after 20 to 30 years. At this point, they abandon their pond and lodge and move on to new habitat. Without constant maintenance, the dam slowly breaks down and eventually breaches. The pond drains, and the previously-submerged seed bank begins to germinate. Shrubs and trees re-establish in the area and, eventually, the open land turns back into a wooded valley. 

If you want to learn more about the history, biology and benefits of having beaver living in local streams, join us for our upcoming virtual Beaver Talk on February 2!

References

Beaver. (n.d.). Pennsylvania Game Commission. Retrieved May 27, 2021, from https://www.pgc.pa.gov:443/Education/WildlifeNotesIndex/Pages/Beaver.aspx

Beaver. (2016, April 25). Smithsonian’s National Zoo. https://nationalzoo.si.edu/animals/beaver

Beaver | National Geographic. (n.d.). Retrieved May 27, 2021, from https://www.nationalgeographic.com/animals/mammals/facts/beaver

Wohl, E. (2021). Legacy effects of loss of beavers in the continental United States. Environmental Research Letters, 16(2), 025010. https://doi.org/10.1088/1748-9326/abd34e

Filed Under: Nature Preserves, Science, Watershed

  • « Previous Page
  • 1
  • 2
  • 3
  • 4
  • 5
  • Next Page »

CONTACT

925 Providence Road
Newtown Square, PA 19073
(610) 353-2562
land@wctrust.org

JOIN OUR MAILING LIST

Copyright © 2025 · WCTRUST.ORG