WILLISTOWN CONSERVATION TRUST

  • Facebook
  • Instagram
  • LinkedIn
  • YouTube
DONATE
  • About
    • HOW WE WORK
    • WHERE WE WORK
    • OUR STAFF AND TRUSTEES
    • JOBS & INTERNSHIPS
    • VOLUNTEER
    • RUSHTON CONSERVATION CENTER
    • STRATEGIC PLAN
    • DIVERSITY, EQUITY & INCLUSION STATEMENT
    • FAQs
  • LATEST
    • BLOG
    • IN THE NEWS
    • PUBLICATIONS
    • PHOTOS
  • PROGRAMS
    • BIRD CONSERVATION
    • COMMUNITY FARM
    • EDUCATION
    • LAND PROTECTION
    • STEWARDSHIP
    • WATERSHED PROTECTION
  • NATURE PRESERVES
    • ASHBRIDGE PRESERVE
    • HARTMAN MEADOW
    • KESTREL HILL PRESERVE
    • KIRKWOOD PRESERVE
    • RUSHTON WOODS PRESERVE
  • EVENTS
    • EVENT CALENDAR
    • BARNS & BBQ
    • RUN-A-MUCK
    • WILDFLOWER WEEK
    • ECOCENTRIC EXPERIENCE
    • RUSHTON NATURE KEEPERS (RNK)
    • ACCESS Program
  • Support
    • WAYS TO GIVE
    • SPONSOR THE TRUST
    • CORPORATE PARTNERSHIP PROGRAM
    • JOIN THE SYCAMORE SOCIETY
    • LEGACY SOCIETY & PLANNED GIVING
    • DELCO Gives 2025
  • CAMPAIGN FOR KESTREL HILL PRESERVE

2022 Lenape Sojourn

September 29, 2022 By Lauren McGrath

By Watershed Protection Program Director Lauren McGrath; Photos by Kate Etherington

On August 16, 2022, Executive Director Kate Etherington and the Watershed Team attended the Lenape Nation of Pennsylvania’s 5th Rising Nation River Journey and signed the Treaty of Renewed Friendship. The Lenape people are the original inhabitants of Delaware, New Jersey, Eastern Pennsylvania, and Southern New York, and were stewards in the Delaware River Watershed for over 10,000 years before the arrival of European settlers. 

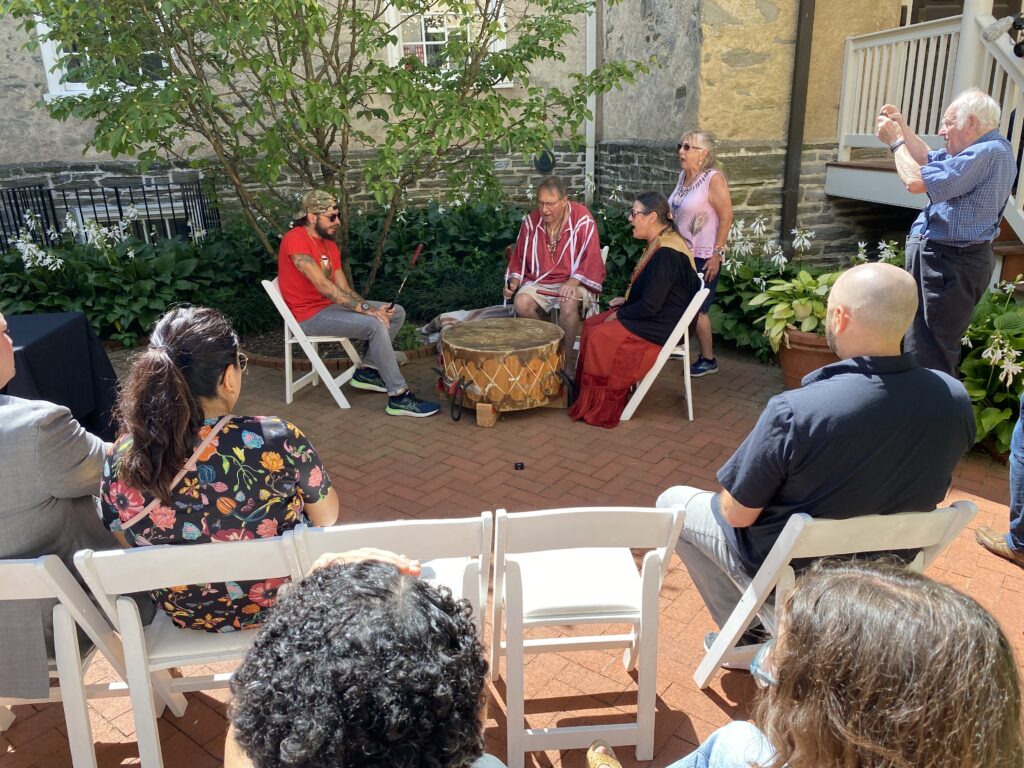
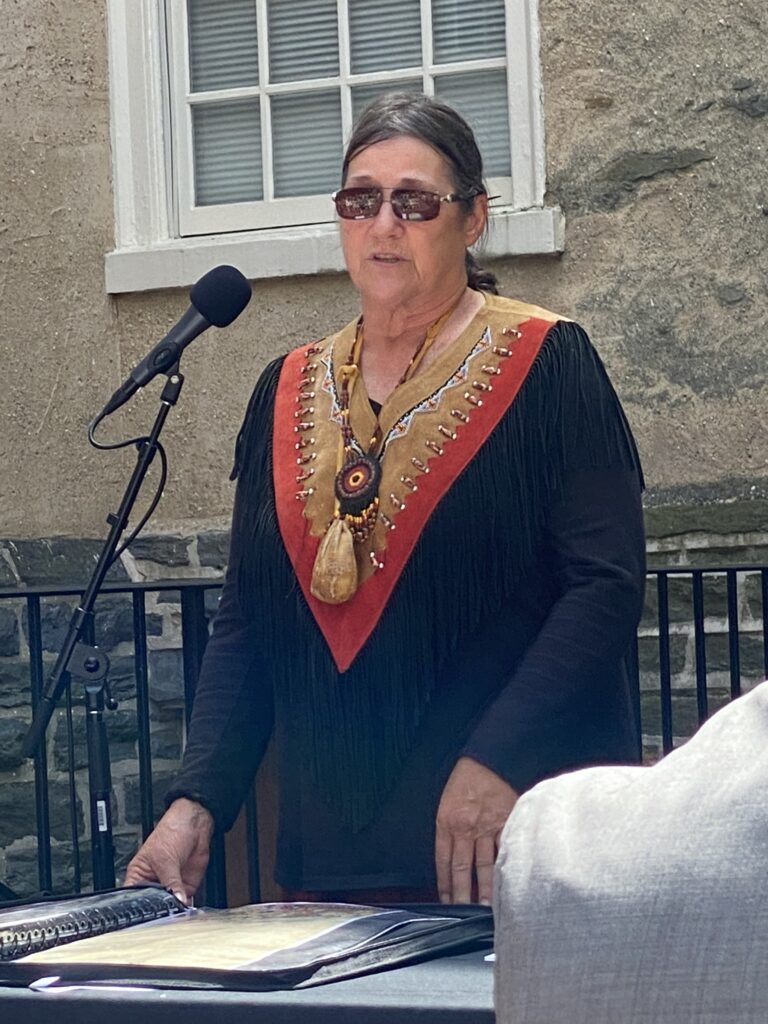
The group of nearly 50 individuals and organizations gathered in the sunny courtyard of Founders Hall at Haverford College, a longtime collaborator with the Lenape Nation, to celebrate the culmination of the River Journey. The ceremony began with smudging, or burning of ceremonial incense, performance of drumming and singing and the sharing of Lenape stories to share the significance of this event by Chief Shelley DePaul, Chief Gentle Moon Demund, and Tribal Council Storykeeper, Adam Waterbear DePaul. The Treaty signing then began, with supporting organizations and individuals taking turns to sign the document. “WCT recognizes the Lenape Nation as the original stewards of this land, and as an organization working to protect the land and waters within the Delaware River Watershed, we are honored to be invited to sign this Treaty, to carry on the tradition of land and water stewardship, and look forward to learning from and partnering more closely with the Lenape Nation in the years to come,” said Kate Etherington. The three week River Journey takes place every four years in August. The goal of this trip down the Delaware (or Lenape Sipu), is to “promote awareness that the Lenape people living in Pennsylvania are carrying on their ancestral traditions, culture and spiritual beliefs, and that they are engaged in numerous projects to provide practical ways for all citizens to respect and protect our homeland and the health, welfare, and future of the next seven generations of our children”1 as well as to elevate that Pennsylvania is one of the only states that does not recognize its indigenous peoples. 

Musicians opened the ceremony with traditional drumming and singing (Photo: Kate Etherington)

The Treaty of Renewed Friendship is an acknowledgement that the Lenape are the indigenous caretakers of these lands and signatories agree to support the Lenape Tribe in their own unique way including: Hosting Cultural / Educational programs, partnering as caretakers of the Lenape homeland and Delaware River, assisting in Lenape Language revival projects, assisting in displays/exhibits of Lenape culture, helping the Lenape people to obtain and/or protect sacred land sites, encouraging updated curriculum in public schools, attending Lenape functions, volunteer service and support, distributing information, financial assistance1. In signing the Treaty of Renewed Friendship, WCT joins a growing list of like minded organizations to collaborate and work towards shared goals of moving forward in our work of promoting respect and protecting the natural environment for future generations. Click here to read the full Treaty.

Chief Shelley DePaul introduces and reads through the Treaty of Renewed Friendship in advance of the signing (Photo: Kate Etherington)

From a historical perspective, WCT’s program area contains at least one important landmark in Lenape Nation history. Okehocking Reservation (a portion of which is now known as Okehocking Preserve), is one of the first Reservations in the United States and many of the Lenape People were moved onto this parcel of land as colonization settled into the Southeastern Pennsylvania landscape. The majority of the Lenape in this Reservation were forcibly removed and driven westward to form communities in Oklahoma, Kansas, Ohio, Indiana, Wisconsin in the late 1800’s2. 

In addition to the historic significance of the Lenape People in Chester County, there is a growing understanding in the scientific and land trust communities that to create climate resilient environments, we must turn back to the ancestral stewards of the landscape and work towards incorporating the knowledge and ethic of these cultures into the work of conservation. WCT is grateful for the opportunity to sign the Treaty of Renewed Friendship with the Lenape Nation of Pennsylvania and focus efforts in the next four years to elevate their voices and knowledge, grow in our understanding of stewarding the landscape, and building meaningful connections with the natural environment.  

Click here to learn more about the Lenape Nation of Pennsylvania and to see upcoming events and educational opportunities (including language classes!) from the Lenape Nation, and be sure to visit the curated exhibit at Haverford College from January through July of 2023.

Wanishi! 

References: 

  1. https://www.lenape-nation.org/
  2. https://glenprovidencepark.org/2011/11/21/the-okehocking-before-the-settlers/

Filed Under: Conservation, Education, Land Protection

State of Our Streams Report Chapter 4: Alkalinity and Hardness

August 24, 2022 By Watershed Protection Team

By Anna Willig and Lauren McGrath | Willistown Conservation Trust Watershed Protection Program

Cover Photo by Jennifer Mathes

Since 2018, the Watershed Protection Program has monitored water quality at ten sample sites in the headwaters of Darby, Crum, and Ridley Creeks (Map 1). Every four weeks, the team visited each of the ten sites to take in-stream measurements and collect samples for analysis in the lab. We are proud to present our findings on water quality based on analysis of our data collected from 2018 through 2021, which includes 41 monitoring visits and over 7500 different measurements. 

August is National Water Quality month, and each week we will publish excerpts from one chapter from our report. Last week, Chapter 3 focused on specific conductivity, chlorides, and nutrients. If you missed the introduction to water chemistry, visit Chapter 1, or the primer on physical stream characteristics, see Chapter 2. This week, we are focusing on alkalinity and hardness. The full report, which includes more information than is provided in the blog posts, can be found here. 

Two final parameters that enhance our understanding of water quality are alkalinity and hardness. Alkalinity measures the ability of water to neutralize acidic compounds and resist changes in pH. Higher alkalinity indicates a greater ability to resist pH changes from pollutants such as wastewater effluent, protecting stream life from acidic or basic environments. Hardness is the concentration of calcium and magnesium ions in the water. Hard water has high concentrations of these ions and is generally more of a nuisance than a health concern for humans or stream life. When water is hard, it can leave behind residue on pipes, potentially leading to lower water pressure or clogging. 

Alkalinity and hardness both remain within acceptable levels for waterways in this region. Alkalinity and hardness are significantly higher in Darby Creek than in Crum and Ridley Creeks. This is most likely due to differences in regional geology, as alkalinity and hardness are primarily affected by the types of rocks and soils that water flows through. However, weathering of man-made materials, particularly concrete, can alter these parameters, and any sudden changes should be investigated. 

For a primer on statistical tests and how to read boxplots and scatterplots, click here.

Alkalinity

Figure 1. Alkalinity from January 2018 through December 2021 (a) across ten sample sites in the headwaters of the Darby, Crum, and Ridley Creeks and (b) over time.

Alkalinity, analyzed quarterly, measures the ability of a body of water to resist changes in pH; higher alkalinity denotes a greater ability to resist pH changes.1 Local geology tends to be the primary driver of alkalinity, though accelerated weathering of natural materials and weathering of man-made materials, namely concrete, increases alkalinity.2 Alkalinity remains above the Pennsylvania Department of Environmental Protection minimum of 20.0 mg/L at all sites.3 

There are significant differences in alkalinity between sites. Alkalinity is significantly higher at Darby Creek at Waterloo Mills (DCWM1) than at all other sites (Figure 1a). Alkalinity does not vary significantly with Crum Creek, but within Ridley Creek, alkalinity is significantly lower at West Branch Ridley Creek (WBRC1) than at Ridley Creek at Okehocking Preserve (RCOK1) (Figure 1a). 

Hardness

Figure 2. Hardness from January 2018 through March 2021 (a) across ten sample sites in the headwaters of the Darby, Crum, and Ridley Creeks and (b) over time.

Hardness, analyzed quarterly, is the concentration of dissolved calcium and magnesium ions in water.4 Hardness is primarily governed by the geology of a region; water dissolves calcium and magnesium as it flows through rocks and soils. Based on standards from the United States Geological Survey, water in Crum Creek is moderately hard, water in Ridley Creek ranges from moderately hard to hard, and water in Darby Creek is hard.4

There are significant differences in hardness between sites. Hardness is significantly higher at DCWM1 than at all sites besides WBRC1 (Figure 2a). Hardness varies significantly within Ridley Creek but not within Crum Creek (Figure 2a). There is little seasonal variation in hardness (Figure 2b).

Key Takeaways

  • Alkalinity is high enough at all sample sites to protect stream life from rapid changes in pH.
  • Water ranges from moderately hard to hard within the sample area. This does not pose any risk to stream life. 
  • Differences in alkalinity and hardness between sites are likely due to differences in regional geology. No actions are needed to alter alkalinity and hardness.

To read the full “State of our Streams Report,” click here.

Map 1. Willistown Conservation Trust’s sampling sites. Five sample locations are within the Ridley Creek watershed, four are within the Crum Creek Watershed, and one is within the Darby Creek Watershed. Sampling was conducted at each site every four weeks from January 2018 through December 2021.

Funding 

This report was made possible through a grant from the William Penn Foundation. The WIlliam Penn Foundation, founded in 1945 by Otto and Phoebe Haas, is dedicated to improving the quality of life in the Greater Philadelphia region through efforts that increase educational opportunities for children from low-income families, ensure a sustainable environment, foster creativity that enhances civic life, and advance philanthropy in the Philadelphia region. In 2021, the Foundation will grant more than $117 million to support vital efforts in the region. 

The opinions expressed in this report are those of the author(s) and do not necessarily reflect the views of the William Penn Foundation. 

References

1. United States Geological Survey. Alkalinity and Water. Water Science School https://www.usgs.gov/special-topic/water-science-school/science/alkalinity-and-water?qt-science_center_objects=0#qt-science_center_objects (2018).

2. Kaushal, S. S. et al. Human-accelerated weathering increases salinization, major ions, and alkalinization in fresh water across land use. Appl. Geochem. 83, 121–135 (2017).

3. Pennsylvania Department of Environmental Protection. 25 Pa. Code Chapter 93. Water Quality Standards § 93.7. Specific Water Quality Criteria. http://www.pacodeandbulletin.gov/Display/pacode?file=/secure/pacode/data/025/chapter93/chap93toc.html&d=reduce (2020).

4. United States Geological Survey. Hardness of Water. Water Science School https://www.usgs.gov/special-topic/water-science-school/science/hardness-water?qt-science_center_objects=0#qt-science_center_objects (2018).

— By Anna Willig and Lauren McGrath | Willistown Conservation Trust Watershed Protection Program

Filed Under: Education, Science, Watershed

State of Our Streams Report Chapter 3: Specific Conductivity, Chloride, and Nutrients

August 17, 2022 By CommIntern

By Anna Willig and Lauren McGrath | Willistown Conservation Trust Watershed Protection Program

Cover Photo by Jennifer Mathes

Since 2018, the Watershed Protection Program has monitored water quality at ten sample sites in the headwaters of Darby, Crum, and Ridley Creeks (Map 1). Every four weeks, the team visited each of the ten sites to take in-stream measurements and collect samples for analysis in the lab. We are proud to present our findings on water quality based on analysis of our data collected from 2018 through 2021, which includes 41 monitoring visits and over 7500 different measurements. 

August is National Water Quality month, and each week we will publish excerpts from one chapter from the report. Last week, Chapter 2 focused on discharge, turbidity, and total suspended solids. Chapter 1 gave an introduction to water chemistry. This week, we are focusing on specific conductivity, chlorides, and nutrients. The full report, which includes more information than is provided in the blog posts, can be found here. 

To better understand potential sources of pollution to the headwaters of Darby, Crum, and Ridley Creeks, we examined specific conductivity, salts, and nutrients. Specific conductivity is a broad water quality measurement that reflects the presence of ions in the water. These ions include compounds that are formed when salts and nutrients dissolve in water. Higher specific conductivity measurements indicate a higher concentration of ions. However, specific conductivity does not provide insight into the type or concentration of ions in the streams. To explain changes in specific conductivity over time or across sites, we monitored salt and nutrient concentrations. 

Chloride is an ion that forms when salts and, to a lesser extent, fertilizers dissolve in water. Elevated chloride concentrations can be toxic for stream organisms. Nutrients, mainly nitrogen and phosphorus, enter streams from fertilizer runoff and leaky septic and sewer systems, all of which increase specific conductivity. When nitrogen and phosphorus are too high, rapid algal growth can occur. This eventually leads to a depletion of dissolved oxygen. Chloride, nitrogen, and phosphorus are all naturally present in low concentrations in streams. However, changes in local land use — specifically increases in development and impervious surface cover — can increase the concentration of these compounds, threatening water quality. An impervious surface is any surface that water cannot pass through, such as buildings, roads, parking lots, and sidewalks. 

All stream samples have elevated specific conductivity (Figure 1). Elevated specific conductivity is driven by salts and nutrients, as indicated by high chloride, total nitrogen, and total phosphorus concentrations, though sites in Crum Creek are less impacted than Ridley and Darby Creek sites. While chloride and total nitrogen do not exceed levels deemed unsafe for human consumption (there are no such regulations for total phosphorus), they are still present in excess, potentially posing a threat to stream organisms. Warm water temperatures (see Chapter 1) may exacerbate the hazards posed by elevated chloride to stream life. 

Monitoring specific conductivity, chloride concentration, and nutrients reveals the importance of land protection for maintaining and improving water quality in our area. Catchments, or drainage areas, with low impervious surface cover have better water quality, as demonstrated by lower specific conductivity, chloride concentration, and nutrient concentration, than catchments with high impervious surface cover (Figure 2). The most impaired sites are Darby Creek at Waterloo Mills (DCWM1) and West Branch Ridley Creek (WBRC1), both of which have 20% impervious cover in their surrounding catchments and a high percentage of developed land. The least impaired site is West Branch Crum Creek (WBCC1), which has 9% impervious cover in its catchment, the lowest of all sites. Improving water quality, especially in Darby and Ridley Creeks, will require a reduction in excessive road salt and fertilizer use. Limiting development upstream of WBCC1 is crucial to protecting and maintaining the health of Crum Creek.

For a primer on statistical tests and how to read boxplots and scatterplots, click here.

Specific Conductivity

Figure 1. Specific conductivity from January 2018 through December 2021 (a) across ten sample sites in the headwaters of the Darby, Crum, and Ridley Creeks and (b) over time.

Specific conductivity measures how well electricity travels through water. Pure water is a poor conductor and has a low specific conductivity. Ions – often from salts (such as sodium chloride), nitrogen and phosphorus-based nutrients, and metal cations – all increase specific conductivity. As many of these ions come from anthropogenic sources, specific conductivity provides insight into the general impact of human activities on waterways. Higher specific conductivity indicates a more heavily impacted stream, but it does not indicate which compounds are entering waterways. Though there are no federal or state standards for specific conductivity, natural background levels of specific conductivity in the sampled stretches of stream are estimated to be between 75 and 95 µS/cm, which is far lower than any values measured.1 Elevated specific conductivity is expected due to the long history of human activity and development within the study area. 

There are significant differences in specific conductivity between sites. Specific conductivity is significantly lower at all Crum Creek sites than at DCWM1 and most Ridley Creek sites (Figure 1a). Interestingly, mean specific conductivity is significantly higher at WBRC1 than Main Stem Ridley Creek (RC1), despite their physical proximity (Figure 1a, Map 1). Check out this blog post to learn more about these two sites. 

Figure 2. The relationship between percent impervious surface cover and mean specific conductivity at ten sample sites in the headwaters of Darby, Crum, and Ridley Creeks from January 2018 through December 2021. Error bars represent standard error. The blue line represents a linear trendline and the shaded region shows the 95% confidence interval. 

Some spatial differences in specific conductivity between sites can be explained by the percent impervious cover in the surrounding watershed. There is a significant positive relationship between mean specific conductivity and percent impervious surface cover (Figure 2). As impervious surface cover reflects the density of human development and specific conductivity reflects human influence on streams, this relationship is unsurprising.

Specific conductivity generally remains constant throughout the year, though it can spike in winter (Figure 1b). Road salts, which are applied in the winter, form chloride when dissolved in water, increasing specific conductivity. The maximum specific conductivity at each site was recorded on days when there was notable snowmelt, indicating that runoff containing road salts is responsible for these spikes.

Chloride 

Figure 3. Monthly analysis of chloride concentration via Quantab strips from January 2019 through December 2021 (a) across ten sample sites in the headwaters of the Darby, Crum, and Ridley Creeks and (b) over time. 

Chloride is naturally present in streams at low concentrations due to the weathering of rocks and soils. Road salt is the main anthropogenic source of chloride in streams, though fertilizers can also contribute chloride. Long-term increases in chloride have been reported nation-wide.2 Chloride impacts ecosystems by altering the microbial communities that form the base of the food chain and by disrupting ion transport in aquatic plants and animals.  Though much is still unknown about the effects of chronic exposure to elevated chloride, warmer temperatures increase the toxicity of chlorides to stream insects, with consequences for the rest of the stream ecosystem.3 Click here to learn more about the impact of elevated chloride levels on streams.

Chloride concentration in the sample area has not exceeded the Pennsylvania Department of Environmental Protection potable water supply standard of 250.3 ppm, though WBRC1 and DCWM1 have reached 247 ppm (Figure 3a).4 There are significant differences in monthly chloride concentration between sites. There are no significant differences in monthly chloride concentration between Crum Creek sites (Figure 3a). However, in Ridley Creek, chloride concentration is significantly lower at Ridley Creek State Park (RCSP1) than at WBRC1, indicating either a reduction in chloride entering the stream or dilution as discharge increases (Figure 3a). Chloride concentration in Darby Creek is comparable to most Ridley Creek sites, with RCSP1 and Crum Creek sites having lower concentrations (Figure 3a). Similar to specific conductivity, chloride is significantly higher at WBRC1 than at RC1, despite their proximity (Figure 3a, Map 1). Chloride concentration is generally higher in winter months than in other seasons due to road salt applications (Figure 3b). 

Nutrients

Nutrients are a group of chemical compounds that are essential to the growth and survival of living organisms. The two most common nutrients are nitrogen and phosphorus, which enter the water through animal waste, fertilizer runoff, and leaky septic and sewer systems, and cycle through the environment in a complex system. An excess of nutrients in streams can trigger a process called eutrophication, which is the rapid growth of vegetation and algae that ultimately reduces dissolved oxygen as vegetation dies and decomposes.5

i. Total Nitrogen

Figure 4. Total nitrogen from January 2018 through March 2020 (a) across ten sample sites in the headwaters of the Darby, Crum, and Ridley Creeks and (b) over time. The dashed line represents the recommended maximum total nitrogen threshold for streams in this ecoregion. 

Total nitrogen measures the concentration of nitrates, nitrites, and ammonia in the water. Total nitrogen dynamics are mostly driven by nitrates, which are present in higher concentrations than nitrites and ammonia. The Pennsylvania Department of Environmental Protection standard for the maximum concentration of nitrates and nitrites in potable water supply is 10 mg/L.4 Total nitrogen does not approach 10 mg/L at any sample sites. 

Though total nitrogen concentration is not high enough to be dangerous for human consumption, concentrations are high enough to impair streams. Two studies of nutrient concentrations in streams in this area have found that the total nitrogen threshold for streams that are not impaired by nutrients is 2.225 – 2.3 mg/L.6-7 In the sample area, the 2.3 mg/L threshold is exceeded in 141 out of 289 samples: at least 20 times by each Ridley Creek site and at most 8 times by each Darby and Crum Creek site (Figure 4b). Furthermore, natural background concentrations of total nitrogen are estimated to be 0.10 – 0.30 mg/L for this region, which is far lower than measured concentrations at all sites (Figure 4b).8 Total nitrogen concentrations are much higher than natural background levels and regularly exceed recommended thresholds, indicating that excess nitrogen is an impairment. 

There are significant differences in total nitrogen between sites (Figure 4a). In Ridley Creek, most downstream sites have significantly lower total nitrogen than most upstream sites, which could be due to dilution with greater volumes of water (Figure 4a). Despite close physical proximity, total nitrogen is significantly higher at WBRC1 than RC1 (Figure 4a, Map 1). There are no significant differences in total nitrogen between sample sites in Crum Creek, and Crum Creek sites and DCWM1 tend to have significantly lower total nitrogen than Ridley Creek sites (Figure 4a). Total nitrogen does not vary seasonally (Figure 4b).

ii. Total Phosphorus

Figure 5. Total phosphorus concentration from January 2018 through March 2020 (a) across ten sample sites in the headwaters of the Darby, Crum, and Ridley Creeks and (b) over time. The shaded region represents estimated natural background concentrations of total phosphorus and the gray hashed line represents the recommended maximum total phosphorus threshold for streams in this ecoregion. 

Total Phosphorus is the total concentration of all phosphorus-containing compounds in streams. Natural background concentrations of total phosphorus are estimated to be 0.025 – 0.060 mg/L for this region.8 In the study area, 55 out of 289 measurements exceed the upper end of this range and 189 exceed the lower end, suggesting that phosphorus may be present in excess (Figure 5b). However, an analysis of nutrient concentrations from 2000 to 2019 in streams in Southeastern Pennsylvania found that the maximum total phosphorus concentration for a stream that is not impaired by nutrients is 0.035 mg/L.7 In the sample area, this threshold is exceeded in almost half of the samples collected (140 out of 289 samples: 24 times each by WBRC1, RCAB1, RCOK1, and RCSP1 and only up to 11 times each by all other sites), indicating that phosphorus is regularly present at high enough concentrations to impair Ridley Creek and is occasionally an impairment in Crum and Darby Creeks. 

There are significant differences in total phosphorus between sites. Total phosphorus does not vary significantly between sites in Darby and Crum Creeks (Figure 5a). In Ridley Creek, WBRC1 has significantly higher total phosphorus than RCSP1 and RC1 (Figure 5a). Though total phosphorus does not show strong seasonal variation, total phosphorus trended higher and had a broader spread from mid-2019 through 2020 than in 2018 (Figure 5b). 

Key Takeaways

  • Specific conductivity is elevated in all streams, indicating that they are impacted by human activities. 
  • Specific conductivity is related to impervious surface cover in the watershed, highlighting the importance of protecting open space and limiting development.
  • Chloride, nitrogen, and phosphorus concentrations are all elevated, contributing to specific conductivity and threatening stream health.
  • Limiting runoff of road salt by sweeping up excess after storms and reporting large piles on roads to municipalities is critical to improving stream health.
  • Reducing chemical fertilizer use or switching to using compost or other soil amendments can limit the amount of nutrients entering streams. Head over to the Farm Program to learn more about soil health.
  • Native plants act as filters for water, pulling out nutrients and other pollutants before they enter streams. Adding native plants to lawns and gardens is a great way to improve water quality while also creating habitat for wildlife.

To read the full “State of our Streams Report,” click here.

Map 1. Willistown Conservation Trust’s sampling sites. Five sample locations are within the Ridley Creek watershed, four are within the Crum Creek Watershed, and one is within the Darby Creek Watershed. Sampling was conducted at each site every four weeks from January 2018 through December 2021.

Funding 

This report was made possible through a grant from the William Penn Foundation. The WIlliam Penn Foundation, founded in 1945 by Otto and Phoebe Haas, is dedicated to improving the quality of life in the Greater Philadelphia region through efforts that increase educational opportunities for children from low-income families, ensure a sustainable environment, foster creativity that enhances civic life, and advance philanthropy in the Philadelphia region. In 2021, the Foundation will grant more than $117 million to support vital efforts in the region. 

The opinions expressed in this report are those of the author(s) and do not necessarily reflect the views of the William Penn Foundation. 

References

1. Olson, J. R. & Cormier, S. M. Modeling spatial and temporal variation in natural background specific conductivity. Environ. Sci. Technol. 53, 4316–4325 (2019).

2. Kaushal, S. S. et al. Freshwater salinization syndrome: from emerging global problem to managing risks. Biogeochemistry 154, 255–292 (2021).

3. Jackson, J. K. & Funk, D. H. Temperature affects acute mayfly responses to elevated salinity: implications for toxicity of road de-icing salts. Philos. Trans. R. Soc. B Biol. Sci. 374, 20180081 (2019).

4. Pennsylvania Department of Environmental Protection. 25 Pa. Code Chapter 93. Water Quality Standards § 93.7. Specific Water Quality Criteria. https://www.pacodeandbulletin.gov/Display/pacode?file=/secure/pacode/data/025/chapter93/chap93toc.html&d=reduce (2020).

5. United States Geological Survey. Phosphorus and Water. Water Science School https://www.usgs.gov/special-topic/water-science-school/science/phosphorus-and-water?qt-science_center_objects=0#qt-science_center_objects (2018).

6. USEPA. Ambient Water Quality Criteria Recommendations: Rivers and Streams in Ecoregion IX. 108 (2000).

7. Clune, J. W., Crawford, J. K. & Boyer, E. W. Nitrogen and Phosphorus Concentration Thresholds toward Establishing Water Quality Criteria for Pennsylvania, USA. Water 12, 3550 (2020).

8. Smith, R. A., Alexander, R. B. & Schwarz, G. E. Natural Background Concentrations of Nutrients in Streams and Rivers of the Conterminous United States. Environ. Sci. Technol. 37, 3039–3047 (2003).

By Anna Willig and Lauren McGrath | Willistown Conservation Trust Watershed Protection Program

Filed Under: Education, Science, Watershed

Microplastics: The ever present contaminant

July 20, 2022 By Watershed Protection Team

By Watershed Protection Program Co-Op Vincent Liu

Large-scale plastic production has been around since the 1950s, and while plastics existed prior, it was not until this time where plastics began making their way into many aspects of life. With the rise of plastic as a popular material, microplastics emerged as a new contaminant. Microplastics are small pieces of plastic, less than 5mm in size, and they are everywhere. In even the most remote waters of Earth, microplastics can be found. Microplastics are not a recent environmental concern as they have been extensively studied in the marine environment. The presence and impact of microplastics on freshwater ecosystems, however, has been a topic of interest in recent years. With its ability to persist in the environment and being incredibly difficult to remove efficiently, microplastics have established themselves as a worrying pollutant.

Microplastics are formed when larger pieces of plastic break apart into smaller ones. They can come from a wide variety of sources, such as textiles, industry, and packaging. Single-use plastics that reach the environment gradually break into microplastics that can then wash into a stream from a storm event. Plastic fibers are easily shed in the washing machine and then end up in wastewater that enters streams and rivers. These are just some of the many ways that microplastics are released into water. The biological effects of microplastics are yet to be clearly defined, but harmful impacts have been found in studies involving freshwater fish and bottom-dwelling macroinvertebrates. Macroinvertebrates are small animals that lack a backbone, and some species are often used by scientists as indicators of stream health. A study by Redondo-Hasselerharm et. al in 2018 showed that the impact of microplastics on macroinvertebrates is species dependent, with some species being highly sensitive to microplastics and others not being affected at all. Specific health effects were also found in fish including liver damage and reduced growth.

I did my senior project on observing microplastics in Pennsylvanian streams while working with the environmental policy organization, PennEnvironment, on their citizen science microplastic project. PennEnvironment staff collected samples while I assisted in processing samples and analyzing the data. The samples were collected in glass jars, to help reduce the plastic contamination, and were run through a filtration system that draws the water sample through a filter, leaving just the suspended solid material from the water. The filter is placed under a microscope to detect the presence of microplastics within the sample. The 4 categories of microplastics that this project looked for were fibers, fragments, films, and beads. Fibers are long, thin strands of plastic that usually come from textiles. Films are flat, wide, and typically transparent. Beads are round spheres, often found in personal care products prior to 2015. Fragments are plastics that do not fit any of the other categories. A microplastic was distinguished from a natural material by using the squish test, which is a simple test done by poking the suspected microplastic with tweezers. Plastic will not break. It will either maintain its shape or mold into a different shape. 

Example of a microfiber viewed under a microscope. Photo by Caitlin Wessel

The results of the project confirmed the presence of microplastics in every stream that was sampled. What was particularly interesting was the low amount of microbeads compared to every other category of plastic. Beads were by far the least common category of microplastic. This can most likely be attributed to the Microbead-Free Waters Act in 2015, which banned plastic microbeads in rinse-off cosmetics. It was also notable that samples had wildly varying amounts of microplastic, though concentration was not calculated for this project. The site photos from where the samples were collected often told a story as well. In one of the sites, there was a blue tarp that was hanging from a tree into the stream just upstream of the collection site. During microplastic analysis for that sample, there was a noticeably high count of blue microfibers. 

Filtration system used to filter microplastic from water and the jars that samples are stored in

Finding ways to remediate microplastic already existing in the environment is an ongoing pursuit, but policy changes can reduce microplastic output from the source. The microbead ban leading to almost a complete disappearance of microbeads in waterways is an example of how legislation can lead to reductions of microplastic contamination. Policy changes in reducing unnecessary plastic usage and encouraging the use of alternative materials will reduce the amount of microplastics entering the streams. After over 70 years of mass plastic production, it may be time to switch gears and look for alternatives. 

— By Watershed Protection Program Co-Op Vincent Liu

References

Parker, B., Andreou, D., Green, I. D., & Britton, J. R. (2021). Microplastics in freshwater fishes: Occurrence, impacts and future perspectives. Fish and Fisheries, 22(3), 467–488. https://doi.org/10.1111/faf.12528

Redondo-Hasselerharm, Paula E., et al. “Microplastic Effect Thresholds for Freshwater Benthic Macroinvertebrates.” Environmental Science & Technology, vol. 52, no. 4, 30 Jan. 2018, pp. 2278–2286, https://pubs.acs.org/doi/10.1021/acs.est.7b05367 

Eerkes-Medrano, D., Thompson, R. C., & Aldridge, D. C. (2015). Microplastics in freshwater systems: A review of the emerging threats, identification of knowledge gaps and prioritisation of research needs. Water Research, 75, 63–82. https://doi.org/10.1016/j.watres.2015.02.012

Birch, Q. T., Potter, P. M., Pinto, P. X., Dionysiou, D. D., & Al-Abed, S. R. (2020). Sources, transport, measurement and impact of nano and microplastics in urban watersheds. Reviews in Environmental Science and Bio/Technology, 19(2), 275–336. https://doi.org/10.1007/s11157-020-09529-x

Geyer, R., Jambeck, J. R., & Law, K. L. (2017). Production, use, and fate of all plastics ever made. Science Advances, 3(7). https://doi.org/10.1126/sciadv.1700782

Center for Food Safety and Applied Nutrition. “The Microbead-Free Waters Act.” U.S. Food and Drug Administration, 2018, www.fda.gov/cosmetics/cosmetics-laws-regulations/microbead-free-waters-act-faqs.b 

Filed Under: Education, Plastic Free July, Watershed

Reducing Single-Use Plastics | What You Can Do to Help

July 14, 2022 By CommIntern

By Outreach & Communications Intern Niya Moss
Cover Photo by Jennifer Mathes

Most people find single-use plastics simple and convenient, but there are alternative, more sustainable options that benefit both humans and the environment. Using these alternatives to single-use plastic will benefit all living beings by reducing the negative impacts on the environment.

Animals are not the only creatures threatened by plastic pollution — humans are, as well. While larger plastic materials are killing aquatic animals, minuscule plastic particles, or microplastics, infect our waterways. As a result, these microscopic plastic particles can easily be consumed by humans since they can travel into our tap water systems. Heavy consumption of these particles can result in serious health issues if left untreated. So how can we avoid endangering lives, including our own? Consider reducing the plastic you use with daily alternatives, including reusable grocery bags and bioplastics.

Reusable Grocery Bags


Reducing our plastic use starts with changing our habits; it’s time to make the switch from plastic bags to reusable bags for grocery shopping. Reusable bags are incredibly convenient and do everything a plastic bag can do without the negative impact on the environment. Reusable bags are developed from sustainable, or recycled, materials and are designed to be used multiple times. When people receive plastic bags from grocery stores, they are likely to throw them out once they’ve put their groceries away. Every year, Americans throw away nearly 1 billion single-use plastic bags after bringing them home. We need to find ways to bring this number down.

In addition to the environmental benefits of reusable bags, they are also more cost effective than plastic bags considering most states are now charging their customers for plastic bags. Rather than getting charged multiple times for several plastic bags, you will only have to buy a reusable bag once and continue using it for as long as it stays in good condition. 

Of course, these reusable bags will get worn out over time, but they are much stronger and more durable than plastic bags, and they can be mended to prolong their durability. Without the need to throw out reusable bags after every use, you are already helping to reduce the use of plastic bags and its threat to our environment. The issues plastic pollution has created over the years are only going to get worse and worse. It’s time to put down that plastic bottle and start using alternatives. It may appear to be inconvenient but it’s for the best. Inconvenience is temporary, but damage to the environment can last for lifetimes.

Biodegradable Plant-Based Plastics

Using biodegradable plant-based plastics, or bioplastics, instead of single-use plastics is safer for the environment. When plastic material is described as biodegradable, it simply means that the plastic can be completely broken down into carbon dioxide, water and compost. Plastic material being biodegradable also implies that the material can decompose within weeks or months. Otherwise, the material is viewed as durable, or material that does not biodegrade as quickly.

So what exactly are biodegradable materials? Bioplastics are made from sugars that are grown from algae or crops. The sugars found in the plants are then converted into plastics. Bioplastics are mainly used in packaging, phone casings, straws, bottles, and medical implants. Using bioplastics will not exactly guarantee that the plastics issues will dissipate, but it does give a helping hand in the reduction of the use of single-use plastics.


Additionally, bioplastics are actually less toxic than single-use plastics, and they are cheaper than normal plastics. What most people are unaware of is the multitude of chemicals that are present within plastics. Plastic products contain chemical additives that can pose serious threats towards an individual’s health.

In addition, using bioplastics will reduce the demand for fossil fuels — such as coal — used to make conventional plastics. Doing so will leave a significantly smaller carbon footprint than normal plastics. As the demand for plastic increases, coal combustion increases to keep up with production. Coal combustion is one of the highest sources of mercury pollution in the ocean. As coal is burned, mercury makes its way into the atmosphere before being washed into the ocean. As this cycle continues, the ocean pollution only worsens. Using more bioplastics would reduce the use of coal combustion thus reducing the amount of carbon dioxide, and other greenhouse gasses, emitted into the atmosphere.

As for how to use biodegradable plastics, here are the basics: biodegradable material cannot be recycled. Now, if you are unsure about your item being biodegradable or not, look for the symbol shown here.

​​ 

Not to be confused with the symbol for recycling, which is a group of three arrows in the shape of a triangle. To properly dispose of biodegradable items, they can simply be thrown into the garbage. Because these items are biodegradable, they will naturally decompose without causing harm to the environment. Another option would be to send your items to a recycling facility that specializes in biodegradable materials.

We all live in and share this environment, which means we all need to do our part in reducing the need for single-use plastics. It will not be easy but with enough time and hard work, we can make the environment better for all living beings to thrive.

— By Outreach & Communications Intern Niya Moss

Filed Under: Education, Plastic Free July

  • « Previous Page
  • 1
  • 2
  • 3
  • 4
  • Next Page »

CONTACT

925 Providence Road
Newtown Square, PA 19073
(610) 353-2562
land@wctrust.org

JOIN OUR MAILING LIST

Copyright © 2025 · WCTRUST.ORG