WILLISTOWN CONSERVATION TRUST

  • Facebook
  • Instagram
  • LinkedIn
  • YouTube
DONATE
  • About
    • HOW WE WORK
    • WHERE WE WORK
    • OUR STAFF AND TRUSTEES
    • JOBS & INTERNSHIPS
    • VOLUNTEER
    • RUSHTON CONSERVATION CENTER
    • STRATEGIC PLAN
    • DIVERSITY, EQUITY & INCLUSION STATEMENT
    • FAQs
  • LATEST
    • BLOG
    • IN THE NEWS
    • PUBLICATIONS
    • PHOTOS
  • PROGRAMS
    • BIRD CONSERVATION
    • COMMUNITY FARM
    • EDUCATION
    • LAND PROTECTION
    • STEWARDSHIP
    • WATERSHED PROTECTION
  • NATURE PRESERVES
    • ASHBRIDGE PRESERVE
    • HARTMAN MEADOW
    • KESTREL HILL PRESERVE
    • KIRKWOOD PRESERVE
    • RUSHTON WOODS PRESERVE
  • EVENTS
    • EVENT CALENDAR
    • BARNS & BBQ
    • RUN-A-MUCK
    • WILDFLOWER WEEK
    • ECOCENTRIC EXPERIENCE
    • RUSHTON NATURE KEEPERS (RNK)
    • ACCESS Program
  • Support
    • WAYS TO GIVE
    • SPONSOR THE TRUST
    • CORPORATE PARTNERSHIP PROGRAM
    • JOIN THE SYCAMORE SOCIETY
    • LEGACY SOCIETY & PLANNED GIVING
    • DELCO Gives 2025
  • CAMPAIGN FOR KESTREL HILL PRESERVE

Watershed Holiday Gift Guide

December 20, 2022 By Watershed Protection Team

Check out some of our favorite watershed-themed gifts by clicking the photos to shop!

And don’t forget to shop local! Use this store locator to order these books from a bookshop near you.

Books for Kids & Adults

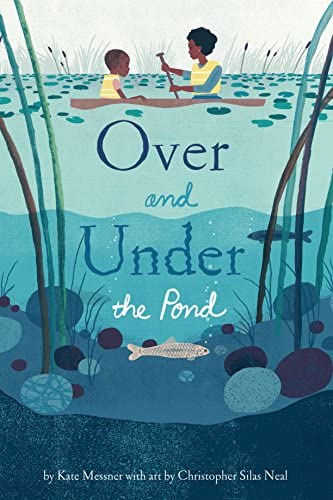
1. Over and Under the Pond by Kate Messner


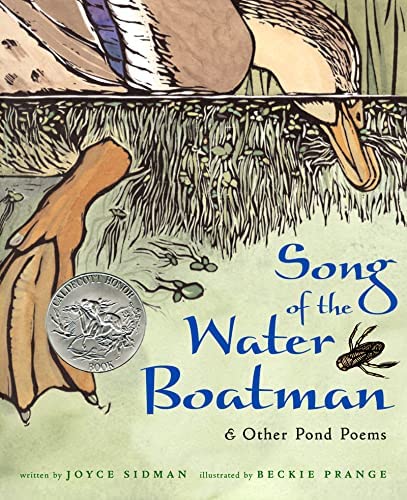
2. Song of the Water Boatman & Other Pond Poems by Joyce Sidman


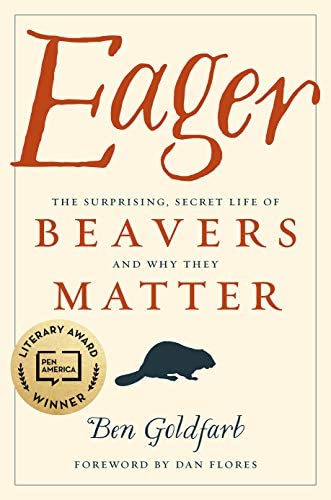
3. Eager: The Surprising, Secret Life of Beavers and Why They Matter by Ben Goldfarb


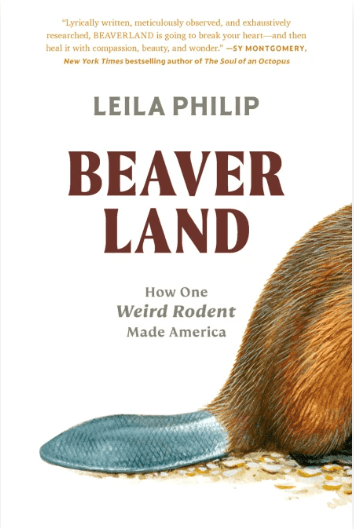
4. Beaver Land by Leila Philip


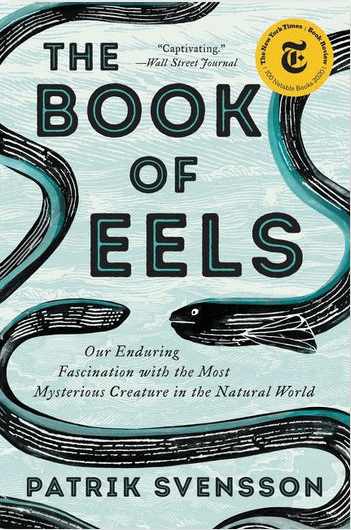
5. The Book of Eels by Patrik Svensson


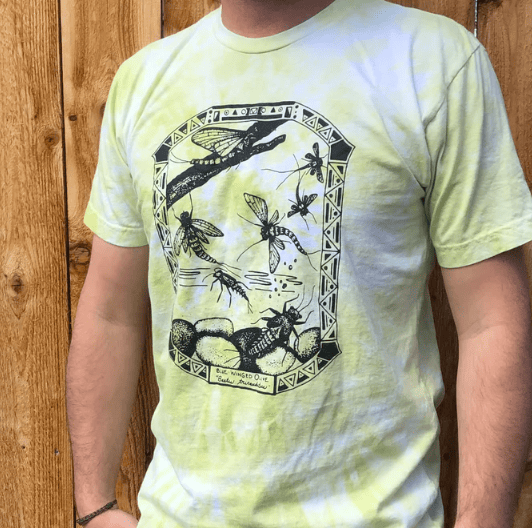
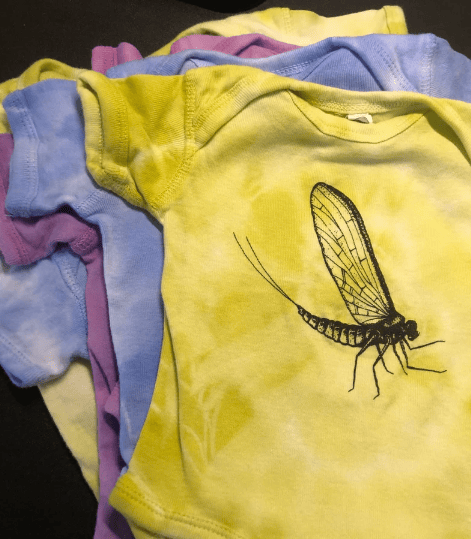
Activities, Clothing, and Jewelry

1. Mayfly T-Shirts


2. Aquatic Insects Activity


3. Caddisfly Jewlery


4. Mayfly Onesies

Filed Under: Watershed

State of Our Streams Report Chapter 4: Alkalinity and Hardness

August 24, 2022 By Watershed Protection Team

By Anna Willig and Lauren McGrath | Willistown Conservation Trust Watershed Protection Program

Cover Photo by Jennifer Mathes

Since 2018, the Watershed Protection Program has monitored water quality at ten sample sites in the headwaters of Darby, Crum, and Ridley Creeks (Map 1). Every four weeks, the team visited each of the ten sites to take in-stream measurements and collect samples for analysis in the lab. We are proud to present our findings on water quality based on analysis of our data collected from 2018 through 2021, which includes 41 monitoring visits and over 7500 different measurements. 

August is National Water Quality month, and each week we will publish excerpts from one chapter from our report. Last week, Chapter 3 focused on specific conductivity, chlorides, and nutrients. If you missed the introduction to water chemistry, visit Chapter 1, or the primer on physical stream characteristics, see Chapter 2. This week, we are focusing on alkalinity and hardness. The full report, which includes more information than is provided in the blog posts, can be found here. 

Two final parameters that enhance our understanding of water quality are alkalinity and hardness. Alkalinity measures the ability of water to neutralize acidic compounds and resist changes in pH. Higher alkalinity indicates a greater ability to resist pH changes from pollutants such as wastewater effluent, protecting stream life from acidic or basic environments. Hardness is the concentration of calcium and magnesium ions in the water. Hard water has high concentrations of these ions and is generally more of a nuisance than a health concern for humans or stream life. When water is hard, it can leave behind residue on pipes, potentially leading to lower water pressure or clogging. 

Alkalinity and hardness both remain within acceptable levels for waterways in this region. Alkalinity and hardness are significantly higher in Darby Creek than in Crum and Ridley Creeks. This is most likely due to differences in regional geology, as alkalinity and hardness are primarily affected by the types of rocks and soils that water flows through. However, weathering of man-made materials, particularly concrete, can alter these parameters, and any sudden changes should be investigated. 

For a primer on statistical tests and how to read boxplots and scatterplots, click here.

Alkalinity

Figure 1. Alkalinity from January 2018 through December 2021 (a) across ten sample sites in the headwaters of the Darby, Crum, and Ridley Creeks and (b) over time.

Alkalinity, analyzed quarterly, measures the ability of a body of water to resist changes in pH; higher alkalinity denotes a greater ability to resist pH changes.1 Local geology tends to be the primary driver of alkalinity, though accelerated weathering of natural materials and weathering of man-made materials, namely concrete, increases alkalinity.2 Alkalinity remains above the Pennsylvania Department of Environmental Protection minimum of 20.0 mg/L at all sites.3 

There are significant differences in alkalinity between sites. Alkalinity is significantly higher at Darby Creek at Waterloo Mills (DCWM1) than at all other sites (Figure 1a). Alkalinity does not vary significantly with Crum Creek, but within Ridley Creek, alkalinity is significantly lower at West Branch Ridley Creek (WBRC1) than at Ridley Creek at Okehocking Preserve (RCOK1) (Figure 1a). 

Hardness

Figure 2. Hardness from January 2018 through March 2021 (a) across ten sample sites in the headwaters of the Darby, Crum, and Ridley Creeks and (b) over time.

Hardness, analyzed quarterly, is the concentration of dissolved calcium and magnesium ions in water.4 Hardness is primarily governed by the geology of a region; water dissolves calcium and magnesium as it flows through rocks and soils. Based on standards from the United States Geological Survey, water in Crum Creek is moderately hard, water in Ridley Creek ranges from moderately hard to hard, and water in Darby Creek is hard.4

There are significant differences in hardness between sites. Hardness is significantly higher at DCWM1 than at all sites besides WBRC1 (Figure 2a). Hardness varies significantly within Ridley Creek but not within Crum Creek (Figure 2a). There is little seasonal variation in hardness (Figure 2b).

Key Takeaways

  • Alkalinity is high enough at all sample sites to protect stream life from rapid changes in pH.
  • Water ranges from moderately hard to hard within the sample area. This does not pose any risk to stream life. 
  • Differences in alkalinity and hardness between sites are likely due to differences in regional geology. No actions are needed to alter alkalinity and hardness.

To read the full “State of our Streams Report,” click here.

Map 1. Willistown Conservation Trust’s sampling sites. Five sample locations are within the Ridley Creek watershed, four are within the Crum Creek Watershed, and one is within the Darby Creek Watershed. Sampling was conducted at each site every four weeks from January 2018 through December 2021.

Funding 

This report was made possible through a grant from the William Penn Foundation. The WIlliam Penn Foundation, founded in 1945 by Otto and Phoebe Haas, is dedicated to improving the quality of life in the Greater Philadelphia region through efforts that increase educational opportunities for children from low-income families, ensure a sustainable environment, foster creativity that enhances civic life, and advance philanthropy in the Philadelphia region. In 2021, the Foundation will grant more than $117 million to support vital efforts in the region. 

The opinions expressed in this report are those of the author(s) and do not necessarily reflect the views of the William Penn Foundation. 

References

1. United States Geological Survey. Alkalinity and Water. Water Science School https://www.usgs.gov/special-topic/water-science-school/science/alkalinity-and-water?qt-science_center_objects=0#qt-science_center_objects (2018).

2. Kaushal, S. S. et al. Human-accelerated weathering increases salinization, major ions, and alkalinization in fresh water across land use. Appl. Geochem. 83, 121–135 (2017).

3. Pennsylvania Department of Environmental Protection. 25 Pa. Code Chapter 93. Water Quality Standards § 93.7. Specific Water Quality Criteria. http://www.pacodeandbulletin.gov/Display/pacode?file=/secure/pacode/data/025/chapter93/chap93toc.html&d=reduce (2020).

4. United States Geological Survey. Hardness of Water. Water Science School https://www.usgs.gov/special-topic/water-science-school/science/hardness-water?qt-science_center_objects=0#qt-science_center_objects (2018).

— By Anna Willig and Lauren McGrath | Willistown Conservation Trust Watershed Protection Program

Filed Under: Education, Science, Watershed

State of Our Streams Report Chapter 2: Physical Stream Parameters

August 10, 2022 By Watershed Protection Team

By Anna Willig and Lauren McGrath | Willistown Conservation Trust Watershed Protection Program

Cover Photo by the Watershed Protection Team

Since 2018, the Watershed Protection Program has monitored water quality at ten sample sites in the headwaters of Darby, Crum, and Ridley Creeks (Map 1). Every four weeks, the team visited each of the ten sites to take in-stream measurements and collect samples for analysis in the lab. We are proud to present our findings on water quality based on analysis of our data collected from 2018 through 2021, which includes 41 monitoring visits and over 7500 different measurements. 

August is National Water Quality month, and each week we will publish excerpts from one chapter from our report. Last week, Chapter 1 we focused on the basic water chemistry parameters of water temperature, dissolved oxygen, and pH. This week, we are focusing on the physical characteristics of the stream: discharge, turbidity, and total suspended solids.

The full report, which includes more information than is provided in the blog posts, can be found here.

_____________________________________________

Monitoring the physical characteristics of streams, in addition to water chemistry, provides deeper insight into water quality and stream health. Discharge is the volume of water flowing through the stream, turbidity is the cloudiness of water, and total suspended solids is a measurement of the total mass of sediment and debris in the water. 

These parameters are influenced by the landscape in the surrounding watershed. Impervious surfaces, or surfaces that block the infiltration of water into the soil, can increase the velocity and energy of water during storm events, allowing stormwater to pick up and carry more sediment into the nearest body of water. By preventing infiltration, impervious surfaces also force more water into streams during storm events, resulting in greater flooding and erosion. The removal of trees and shrubs along waterways destabilizes soil, leading to more sediment in streams. Headwater streams, which are the origins of stream systems, can carry tons of sediment and pollution into the stream throughout the entire waterway, harming downstream ecosystems. Studying discharge and sediment dynamics can help identify areas of rapid erosion that should be targeted for restoration.

The headwaters of Darby, Crum, and Ridley Creeks are highly responsive to rainfall events, as indicated by spikes in discharge after storm events. There is constant, though often low, movement of sediment through the sample sites, as indicated by turbidity and total suspended solids. Sediment movement increases after rainfall or snowmelt events. Though there are no regulations governing acceptable amounts of sediment in streams, it is possible that sediment poses a risk to stream life during storm events. Analysis of sediment movement and erosion dynamics is ongoing to identify areas where restoration should target soil stabilization.

For a primer on statistical tests and how to read boxplots and scatterplots, click here.

Discharge

Figure 1. Stream discharge from January 2018 through December 2021 (a) across ten sample sites in the headwaters of the Darby, Crum, and Ridley Creeks and (b) over time.

Discharge is the volume of water flowing through a stream and is measured in cubic meters per second (m3/s). Discharge reflects the size of the stream; as more tributaries enter the stream and it gets bigger, discharge increases as well. Prior to June 5, 2019, discharge was not consistently measured on sample days.

There are significant differences in discharge between sites. Within each watershed, discharge is significantly higher at the most downstream site than it is at the most upstream sites, as expected, and discharge at Ridley Creek State Park (RCSP1) is significantly greater than discharge at all other sample sites (Figure 1a). 

Spikes in discharge are related to rainfall or snowmelt events, which increase the amount of water flowing through the stream. Changes can also be caused by debris in the stream channel. For example, the abrupt increase in discharge at RCSP1 on September 25, 2019 was likely caused by a downed tree that dammed Ridley Creek just downstream of the sample site (Figure 1b). By January 8, 2020, the tree was cleared and discharge returned to normal (Figure 1b). Decreases in discharge during summer months are generally caused by lack of rainfall. The lowest discharge at all sites but Crum Creek Main Stem Downstream (CC3) was recorded on August 16, 2021, after an extended period with little rain (Figure 1b).

Turbidity

Figure 2. Turbidity from January 2018 through December 2021 (a) across ten sample sites in the headwaters of the Darby, Crum, and Ridley Creeks and (b) over time. 

Turbidity measures the amount of light that can pass through a water sample. Clear water has low turbidity and cloudy water has high turbidity. Turbidity provides an estimate for the amount of sand, silt, and other sediment in the water; as the amount of sediment in the water increases, so does the turbidity. However, turbidity is sensitive to the type of sediment — differences in the size, texture, and shape of sediment particles impact turbidity measurements — and should be considered a gross approximation for sediment concentration.

There are no significant differences in turbidity between sites (Figure 2a). Turbidity does not vary seasonally (Figure 2b). There is a significant but weak correlation between turbidity and discharge, suggesting that spikes in turbidity are related to influxes of sediment after rainfall or snowmelt events. The weakness of the relationship is likely due to differences in the amount of erosion and the type of sediment at each sample site.

Total Suspended Solids

Figure 3. Total suspended solids from January 2018 through December 2021 (a) across ten sample sites in the headwaters of the Darby, Crum, and Ridley Creeks and (b) over time. (c) The relationship between turbidity and total suspended solids.The blue line is the linear trendline and the shaded region represents the 95% confidence interval.

Closely related to turbidity is total suspended solids, or the mass of suspended particles, usually sediment, in a specified volume of water. While turbidity roughly estimates the amount of sediment in the water, total suspended solids is a more exact approximation. Though the transport of sediment is a natural process in streams and rivers, excess or sudden movement of sediment can harm aquatic organisms. When sediment is deposited on stream beds, it can smother macroinvertebrates and cover crucial streambed habitat. In the water column, suspended solids absorb sunlight, heating up the water and limiting the ability of aquatic plants and algae to photosynthesize. Though total suspended solids analysis helps understand erosion and sediment movement in waterways, there are no state or federal standards governing acceptable concentrations of total suspended solids.

There are no significant differences in total suspended solids between sites (Figure 3a). total suspended solids does not show strong seasonal variation; spikes in total suspended solids are likely due to influxes of sediment after precipitation events (Figure 3b). There is a significant, but weak, correlation between discharge and total suspended solids. There is a significant correlation between turbidity and total suspended solids, indicating that turbidity can reflect total suspended solids (Figure 3c). However, due to differences in sediment characteristics, turbidity should only be used to predict total suspended solids at a site-specific scale.

Future analysis includes developing a rating curve to estimate the amount of sediment moving through a stream, which will help identify areas of rapid erosion that should be targeted for restoration.

Key Takeaways

  • Discharge generally remains constant, but is responsive to rainfall events. 
  • There is constant, though often low, movement of sediment through our streams.
  • Storm events can wash large quantities of sediment into streams, potentially posing a risk to aquatic organisms. 
  • To learn more about discharge, erosion, and flooding, check out Flooding 101 and Flooding 102. 

To read the full “State of our Streams Report,” click here.

Map 1. Willistown Conservation Trust’s sampling sites. Five sample locations are within the Ridley Creek watershed, four are within the Crum Creek Watershed, and one is within the Darby Creek Watershed. Sampling was conducted at each site every four weeks from January 2018 through December 2021.

Funding 

This report was made possible through a grant from the William Penn Foundation. The WIlliam Penn Foundation, founded in 1945 by Otto and Phoebe Haas, is dedicated to improving the quality of life in the Greater Philadelphia region through efforts that increase educational opportunities for children from low-income families, ensure a sustainable environment, foster creativity that enhances civic life, and advance philanthropy in the Philadelphia region. In 2021, the Foundation will grant more than $117 million to support vital efforts in the region. 

The opinions expressed in this report are those of the author(s) and do not necessarily reflect the views of the William Penn Foundation. 

— By Anna Willig and Lauren McGrath | Willistown Conservation Trust Watershed Protection Program

Filed Under: Science, Watershed

State of Our Streams Report Chapter 1: Introduction and Basic Stream Parameters

August 3, 2022 By Watershed Protection Team

By Anna Willig and Lauren McGrath | Willistown Conservation Trust Watershed Protection Program

Cover Photo by Jennifer Mathes

The focus area of Willistown Conservation Trust  (WCT) includes over 190 miles of headwater streams in the Darby Creek, Crum Creek, and Ridley Creek watersheds, which are all tributaries to the Delaware River. Everything that happens in the headwaters of a stream impacts the rest of the system, meaning that any action taken in the WCT focus area has consequences for water quality that extend far beyond our region. 

The Watershed Protection Program was established in 2017 through a generous grant from William Penn Foundation and a strong partnership with the Academy of Natural Sciences of Drexel University. The Watershed Protection Program is part of the Delaware River Watershed Initiative (DRWI), which was established to study existing water conditions within the Delaware River basin and to coordinate efforts, around both data collection and analysis, to develop best management practices for land use that can help improve water quality. With the support of the Academy of Natural Sciences of Drexel University and Stroud Water Research Center, WCT Watershed Protection staff implemented a water quality monitoring program to understand how WCT’s conservation efforts have impacted local stream health. 

Since 2018, the Watershed Protection Program has monitored water quality at ten sample sites in the headwaters of Darby, Crum, and Ridley Creeks (Figure 1). Every four weeks, the team visited each of the ten sites to take in-stream measurements and collect samples for analysis in the lab. We are proud to present our findings on water quality based on analysis of our data collected from 2018 through 2021, which includes 41 monitoring visits and over 7,500 different measurements. 

August is National Water Quality month, and each week we will publish excerpts from one chapter of our report. The full report, which includes more information than is provided in the blog posts, will be released at the end of the month. This week, we are focusing on three parameters that make up the backbone of water quality monitoring: water temperature, dissolved oxygen, and pH.

The full report, which includes more information than is provided in the blog posts, can be found here.

_____________________________________________

Figure 1. Willistown Conservation Trust’s water chemistry sampling sites. Five sample locations are within the Ridley Creek watershed, four are within the Crum Creek Watershed, and one is within the Darby Creek Watershed. Sampling was conducted at each site every four weeks from January 2018 through December 2021.

In the headwater streams studied for this report, water temperature is driven by air temperature, causing strong seasonal variation, with near-freezing temperatures in the winter and high temperatures in the summer. Water temperature is also linked to land use. The removal of trees along streams exposes streams to direct sunlight, warming the water. Additionally, parking lots, roads, and sidewalks all absorb heat in the summer and warm up rainfall before it enters streams, further raising water temperatures. Elevated water temperature is of concern due to its relationship with dissolved oxygen in streams. In waterways, dissolved oxygen represents the amount of oxygen available for use by aquatic organisms. As temperature increases, water can hold less dissolved oxygen, meaning there may not be enough for all organisms living in the stream.  

Another key benchmark for stream health is pH, which measures how acidic or basic the water is. If water is too acidic or basic, it becomes toxic for many aquatic organisms, even if water temperature is not too high and there is enough dissolved oxygen. Thus, measuring water temperature, dissolved oxygen, and pH can quickly reveal how hospitable streams are for aquatic life.

Results from analysis of our data indicate that water temperature is an impairment at our sample sites. Temperature is elevated at all sample sites, especially during summer months, stressing sensitive aquatic organisms such as trout and freshwater mussels. Dissolved oxygen does not drop below levels deemed unsafe for aquatic life, but it is not high enough during summer months to support the reproduction of trout populations. pH remains within the range deemed safe for aquatic life, though it can approach dangerous levels at some sites. 

For a primer on statistical tests and how to read boxplots and scatterplots, click here.

Water Temperature

Figure 2. Water temperature from January 2018 through December 2021 (a) across ten sample sites in the headwaters of the Darby, Crum, and Ridley Creeks and (b) over time. The lines represent maximum allowable temperatures for a Cold Water Fishery (CWF), Trout Stocked Fishery (TSF), and Warm Water Fishery (WWF). 

Water temperature is the primary parameter by which the Pennsylvania Department of Environmental Protection designates protected uses for streams. Water temperature is closely linked to the amount of dissolved oxygen in the water and, consequently, different species can tolerate different temperatures. The three protected uses that have temperature criteria are Cold Water Fisheries, Warm Water Fisheries and Trout Stocked Fisheries. A Cold Water Fishery supports the survival and reproduction of Salmonidae fish species (including Brook Trout, Salvelinus fontinalis) and other aquatic flora and fauna that require a cold water habitat, while a Warm Water Fishery supports the survival of fish and aquatic flora and fauna that can tolerate a warmer habitat.1 A Trout Stocked Fishery supports the survival of stocked trout from February 15 to July 31 in addition to all the species supported by a Warm Water Fishery.1

There are no significant differences in water temperature between sample sites (Figure 2a). Water temperatures are regularly above Cold Water Fishery maximums at all sample sites throughout the year. In winter and spring months, water temperatures can exceed Warm Water Fishery and Trout Stocked Fishery maximums during unseasonably warm days. During summer months, water temperatures are consistently below Warm Water Fishery maximums but occasionally exceed Trout Stocked Fishery maximums during heat waves. The frequency with which temperature exceeds Cold Water Fishery requirements and the occasional exceedance of Warm Water Fishery and Trout Stocked Fishery maximums signifies that all sites are impaired by elevated temperature (Figure 2b). This stresses sensitive organisms such as Brook Trout, freshwater mussels, and stream insects like mayflies, stoneflies, and caddisflies.

Dissolved Oxygen

Figure 3. Dissolved oxygen content from January 2018 through December 2021 (a) across ten sample sites in the headwaters of the Darby, Crum, and Ridley Creeks and (b) over time.

All living animals require oxygen to breathe, and stream-dwelling organisms like fish and aquatic insects are no exception. Dissolved oxygen is temperature dependent. Cold water can hold a higher concentration of dissolved oxygen than warm water; consequently, dissolved oxygen is highest in the winter and lowest in the summer (Figure 3b). Dissolved oxygen is also related to photosynthesis. As aquatic primary producers, or plants and algae, photosynthesize during the day, they increase the amount of dissolved oxygen in the water. Conversely, as these producers cease photosynthesis at night, they consume oxygen through respiration, decreasing the amount of dissolved oxygen in the water. As a result, dissolved oxygen follows a daily cycle, rising during the day and falling during the night.2

The amount of dissolved oxygen in the water impacts the reproduction and survival of many species. If dissolved oxygen drops below a certain level, aquatic organisms will be too stressed to reproduce. If it drops further, these organisms may suffocate and die. The dissolved oxygen standard for a Cold Water Fishery, according to the Pennsylvania Department of Environmental Protection, depends on the presence or absence of naturally reproducing fish in the Salmonidae family, which includes all trout species. To the best of our understanding, none of the sampled streams have naturally reproducing salmonids, so the dissolved oxygen standards for a Cold Water Fishery are at least 6.0 mg/L over a 7-day average with a minimum of 5.0 mg/L at any given time.3 Dissolved oxygen has not dropped below 7.0 mg/L at any sample sites, but all measurements were taken during daylight hours and do not capture nighttime dissolved oxygen minimums. Consequently, it is unclear whether dissolved oxygen is within the range of a Cold Water Fishery at the sample sites. 

There are significant differences in dissolved oxygen between sites, with significantly higher dissolved oxygen  at Ridley Creek at Okehocking Preserve (RCOK1) than at Crum Creek Main Stem Upstream (CC2) and Darby Creek at Waterloo Mills (DCWM1) (Figure 3a). This difference is likely due to sampling time: RCOK1 is sampled in the afternoon, when photosynthesis is highest and dissolved oxygen peaks, while CC2 and DCWM1 are sampled in the morning, when there is less photosynthesis and dissolved oxygen is consequently lower. However, Ridley Creek State Park (RCSP1) and Crum Creek Main Stem Downstream (CC3) are also sampled in the afternoon and are not significantly higher than DCWM1 and CC2, suggesting that other factors, in addition to photosynthesis, may explain the differences in dissolved oxygen at these sites.

pH

Figure 4. Stream pH from January 2018 through December 2021 (a) across ten sample sites in the headwaters of the Darby, Crum, and Ridley Creeks and (b) over time.

Another important water quality parameter is pH, which measures how acidic or basic water is. A pH of 7.0 is neutral, a pH below 7.0 is acidic, and a pH above 7.0 is basic. pH determines how easily an aquatic organism can use nutrients and indicates how toxic pollutants may be. To qualify as a protected fishery by the Pennsylvania Department of Environmental Protection, a stream must have a pH between 6.0 and 9.0.3 When pH is outside this range, nutrients become difficult to absorb and pollutants become more toxic, stressing organisms and leading to a reduction in biodiversity. Stream pH is influenced by in-stream photosynthesis, local soil type, geology, and human-based pollution. 

The pH of each stream in the study area tends to be slightly basic. No sites have pH measurements outside the 6.0 – 9.0 range designated by Pennsylvania Department of Environmental Protection as a protected fishery, though RCOK1 and RCSP1 reach over 8.9.3 pH does not exhibit strong seasonal variation (Figure 4b). 

There are significant differences in pH between sites. pH is significantly higher at RCOK1 than at all other sample sites and is also elevated at CC3 and RCSP1 (Figure 4a). Some variation in pH between sites could be explained by the sampling time. Photosynthesis increases the pH of streams by removing carbon dioxide. Photosynthesis peaks in the afternoon and, consequently, pH tends to be higher in the afternoon. RCOK1, RCSP1, and CC3 are always sampled in the afternoon, therefore, photosynthesis likely explains the elevated pH at these sites. 

Key Takeaways

  • Water temperature is a significant impairment at all sample sites and any effort to restore Darby, Crum, and Ridley Creeks must aim to reduce water temperatures.
  • There is generally enough dissolved oxygen to support the survival of aquatic organisms, though it may be low enough in the summer to stress and limit the reproduction of sensitive groups.
  • pH is within a safe range at all sample sites, though it can approach unsafe levels at RCOK1 and RCSP1. 
  • The best way to address water temperature impairments is to plant native trees and shrubs along waterways. Click here for more information on the role of riparian plants, and check out these resources from WCT’s Stewardship Team to learn more about the best native plants to plant in these areas.

To read the full “State of our Streams Report,” click here.

Funding 

This report was made possible through a grant from the William Penn Foundation. The William Penn Foundation, founded in 1945 by Otto and Phoebe Haas, is dedicated to improving the quality of life in the Greater Philadelphia region through efforts that increase educational opportunities for children from low-income families, ensure a sustainable environment, foster creativity that enhances civic life, and advance philanthropy in the Philadelphia region. In 2021, the Foundation will grant more than $117 million to support vital efforts in the region. 

The opinions expressed in this report are those of the author(s) and do not necessarily reflect the views of the William Penn Foundation. 

References

1. Pennsylvania Department of Environmental Protection. 25 Pa. Code Chapter 93. Water Quality Standards § 93.3. Protected water uses. http://www.pacodeandbulletin.gov/Display/pacode?file=/secure/pacode/data/025/chapter93/chap93toc.html&d=reduce (2009).

2. Wilson, P. C. Dissolved Oxygen. 9 https://edis.ifas.ufl.edu/publication/SS525 (2019).

3. Pennsylvania Department of Environmental Protection. 25 Pa. Code Chapter 93. Water Quality Standards § 93.7. Specific Water Quality Criteria. http://www.pacodeandbulletin.gov/Display/pacode?file=/secure/pacode/data/025/chapter93/chap93toc.html&d=reduce (2020).

4. Kellner, E. & Hubbart, J. A. Advancing Understanding of the Surface Water Quality Regime of Contemporary Mixed-Land-Use Watersheds: An Application of the Experimental Watershed Method. Hydrology 4, 31 (2017).

5. Mealy, R. & Bowman, G. Importance of General Chemistry Relationships in Water Treatment. (2004).6. Mesner, N. & Geiger, J. pH. (2005).

— By Anna Willig and Lauren McGrath | Willistown Conservation Trust Watershed Protection Program

Filed Under: Science, Watershed

Project Plastic and the Hunt for Microplastics

July 27, 2022 By Watershed Protection Team

By Amy Amatya of Project Plastic

Some of the greatest challenges humanity faces today — pandemics, climate change, water contamination — are invisible. They escalate because we don’t see them coming, or we ignore the data that help us see them. 

Microplastics are no exception. Defined as any plastic smaller than five millimeters in diameter, microplastics pose a big problem to the environment and ourselves. They are easily ingested, potentially toxic, and everywhere. In fact, microplastics are found in nearly every corner of the world, right down to the tissues of living organisms. 

Microplastics exist via two pathways: they are mass-produced to be this size (‘primary’), or they come from the degradation of larger plastics (‘secondary’). Primary microplastics are difficult to target because production is controlled by industries including textiles, cosmetics, and household items. Considerable persuasion of regulators and corporations is necessary to reduce microplastic production. Some progress has been made on this front, as the Microbead-Free Waters Act of 2015 prohibits microplastic use in wash-off cosmetics. However, secondary microplastics are difficult to target because a lot of plastic already exists in the world. The sheer difference in scale between microplastics and the landscapes they inhabit prohibit remediation. Even if we ceased all plastic production today, there are still 200 million tons of plastic circulating in our oceans.

Despite their huge threat, there are no consistent protocols available for the accurate and 

systematic recording of microplastic pollutant concentrations in water. There is also no existing technology available to sequester all microplastics from tributaries, effluent streams, reservoirs and lakes. There are three approaches to reducing microplastic pollution. We can: 

1) Produce less plastic, 

2) Prevent existing plastic from entering the environment, and 

3) Remove microplastics directly from the environment. 

The Project Plastic meets with the ACUA Wastewater Treatment Facility about the future of Plastic Hunters in wastewater management systems. Photo by Project Plastic

Project Plastic was moved by the third approach to develop the world’s first portable, affordable, and environmentally friendly microplastic measuring and sequestration device. Project Plastic is a team of chemists and architectural designers, but we aren’t just a filtration technology company. Driven foremost by the microplastic problem, we follow microplastics to the end of their aquatic lifetime. We strive to collaborate with riverkeepers, water treatment companies, and private bottled water companies to monitor, collect, and upcycle microplastic pollution from waterways. 

Our device utilizes a patented ‘artificial root’ technology that acts as a filter to remove small debris (including microplastics) from the upper water column, where most plastic pollutants accumulate. Our root technology is modeled after organic aquatic plant roots. Long fibrous filaments are suspended in water and sediments physically adhere to the dense fibers on each root. Naturally-occurring biofilms accumulate on the ‘artificial root’ network over time, which further traps small particles. By applying an array of ‘artificial roots’ to the underside of a flotational frame, our device can entrap large quantities of microplastics while allowing aquatic wildlife to swim below or between our filter. Each biofilter is attached to a removable pad, making it easy to swap biofilters once they become saturated. Each pad is housed within a hydrodynamic flotation frame for application in rivers, streams, and reservoirs.

The Plastic Hunter: a portable, affordable microplastic filter inspired by plant roots. Image created by Project Plastic

The Plastic Hunter has a key advantage over conventional filtration technologies: it has no mechanical components, meaning it can operate passively with no electricity and minimal maintenance. This makes the device far cheaper to produce, deploy and maintain compared to any existing microplastic filtration system.

Lastly, our team is currently working on establishing protocols for the separation and purification of contaminated sediments from our filter media. In doing so, our team hopes to extract relatively pure microplastic sediments from our devices to be forwarded to our research collaborators at the University of Washington in St Louis. The aim is to develop a method of converting microplastics into chemical compounds like carotene. If successful, our team may be able to upcycle microplastics into useful chemicals for other industries like pharmaceuticals, turning harmful waste into sustainable resources. This, we hope, will avoid environmentally harmful storage or processing of contaminated sediment through incineration, and instead propagate a circular economy for microplastic waste.

— By Amy Amatya of Project Plastic

Filed Under: Nature, Science, Watershed

  • « Previous Page
  • 1
  • …
  • 3
  • 4
  • 5
  • 6
  • 7
  • …
  • 10
  • Next Page »

CONTACT

925 Providence Road
Newtown Square, PA 19073
(610) 353-2562
land@wctrust.org

JOIN OUR MAILING LIST

Copyright © 2025 · WCTRUST.ORG